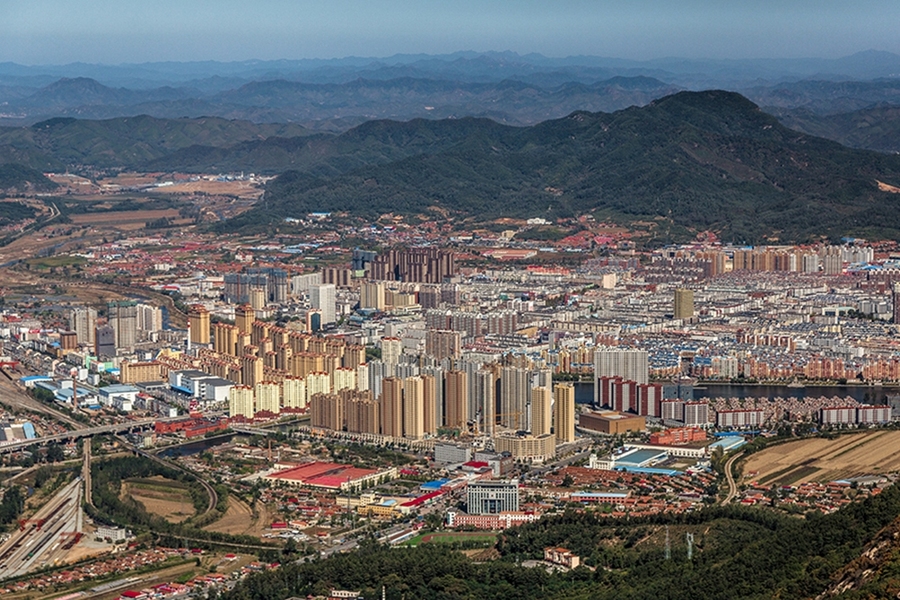

In recent decades, urban populations in China’s cities have grown substantially, and rising incomes have led to a rapid expansion of car ownership. Indeed, China is now the world’s largest market for automobiles. The combination of urbanization and motorization has led to an urgent need for transportation policies to address urban problems such as congestion, air pollution, and greenhouse gas emissions.
For the past three years, an MIT team led by Joanna Moody, research program manager of the MIT Energy Initiative’s Mobility Systems Center, and Jinhua Zhao, the Edward H. and Joyce Linde Associate Professor in the Department of Urban Studies and Planning (DUSP) and director of MIT’s JTL Urban Mobility Lab, has been examining transportation policy and policymaking in China. “It’s often assumed that transportation policy in China is dictated by the national government,” says Zhao. “But we’ve seen that the national government sets targets and then allows individual cities to decide what policies to implement to meet those targets.”
Many studies have investigated transportation policymaking in China’s megacities like Beijing and Shanghai, but few have focused on the hundreds of small- and medium-sized cities located throughout the country. So Moody, Zhao, and their team wanted to consider the process in these overlooked cities. In particular, they asked: how do municipal leaders decide what transportation policies to implement, and can they be better enabled to learn from one another’s experiences? The answers to those questions might provide guidance to municipal decision-makers trying to address the different transportation-related challenges faced by their cities.
The answers could also help fill a gap in the research literature. The number and diversity of cities across China has made performing a systematic study of urban transportation policy challenging, yet that topic is of increasing importance. In response to local air pollution and traffic congestion, some Chinese cities are now enacting policies to restrict car ownership and use, and those local policies may ultimately determine whether the unprecedented growth in nationwide private vehicle sales will persist in the coming decades.
Policy learning
Transportation policymakers worldwide benefit from a practice called policy-learning: Decision-makers in one city look to other cities to see what policies have and haven’t been effective. In China, Beijing and Shanghai are usually viewed as trendsetters in innovative transportation policymaking, and municipal leaders in other Chinese cities turn to those megacities as role models.
But is that an effective approach for them? After all, their urban settings and transportation challenges are almost certainly quite different. Wouldn’t it be better if they looked to “peer” cities with which they have more in common?
Moody, Zhao, and their DUSP colleagues — postdoc Shenhao Wang and graduate students Jungwoo Chun and Xuenan Ni, all in the JTL Urban Mobility Lab — hypothesized an alternative framework for policy-learning in which cities that share common urbanization and motorization histories would share their policy knowledge. Similar development of city spaces and travel patterns could lead to the same transportation challenges, and therefore to similar needs for transportation policies.
To test their hypothesis, the researchers needed to address two questions. To start, they needed to know whether Chinese cities have a limited number of common urbanization and motorization histories. If they grouped the 287 cities in China based on those histories, would they end up with a moderately small number of meaningful groups of peer cities? And second, would the cities in each group have similar transportation policies and priorities?
Grouping the cities
Cities in China are often grouped into three “tiers” based on political administration, or the types of jurisdictional roles the cities play. Tier 1 includes Beijing, Shanghai, and two other cities that have the same political powers as provinces. Tier 2 includes about 20 provincial capitals. The remaining cities — some 260 of them — all fall into Tier 3. These groupings are not necessarily relevant to the cities’ local urban and transportation conditions.
Moody, Zhao, and their colleagues instead wanted to sort the 287 cities based on their urbanization and motorization histories. Fortunately, they had relatively easy access to the data they needed. Every year, the Chinese government requires each city to report well-defined statistics on a variety of measures and to make them public.
Among those measures, the researchers chose four indicators of urbanization — gross domestic product per capita, total urban population, urban population density, and road area per capita — and four indicators of motorization — the number of automobiles, taxis, buses, and subway lines per capita. They compiled those data from 2001 to 2014 for each of the 287 cities.
The next step was to sort the cities into groups based on those historical datasets — a task they accomplished using a clustering algorithm. For the algorithm to work well, they needed to select parameters that would summarize trends in the time series data for each indicator in each city. They found that they could summarize the 14-year change in each indicator using the mean value and two additional variables: the slope of change over time and the rate at which the slope changes (the acceleration).
Based on those data, the clustering algorithm examined different possible numbers of groupings, and four gave the best outcome in terms of the cities’ urbanization and motorization histories. “With four groups, the cities were most similar within each cluster and most different across the clusters,” says Moody. “Adding more groups gave no additional benefit.”
The four groups of similar cities are as follows.
Cluster 1: 23 large, dense, wealthy megacities that have urban rail systems and high overall mobility levels over all modes, including buses, taxis, and private cars. This cluster encompasses most of the government’s Tier 1 and Tier 2 cities, while the Tier 3 cities are distributed among Clusters 2, 3, and 4.
Cluster 2: 41 wealthy cities that don’t have urban rail and therefore are more sprawling, have lower population density, and have auto-oriented travel patterns.
Cluster 3: 134 medium-wealth cities that have a low-density urban form and moderate mobility fairly spread across different modes, with limited but emerging car use.
Cluster 4: 89 low-income cities that have generally lower levels of mobility, with some public transit buses but not many roads. Because people usually walk, these cities are concentrated in terms of density and development.
City clusters and policy priorities
The researchers’ next task was to determine whether the cities within a given cluster have transportation policy priorities that are similar to each other — and also different from those of cities in the other clusters. With no quantitative data to analyze, the researchers needed to look for such patterns using a different approach.
First, they selected 44 cities at random (with the stipulation that at least 10 percent of the cities in each cluster had to be represented). They then downloaded the 2017 mayoral report from each of the 44 cities.
Those reports highlight the main policy initiatives and directions of the city in the past year, so they include all types of policymaking. To identify the transportation-oriented sections of the reports, the researchers performed keyword searches on terms such as transportation, road, car, bus, and public transit. They extracted any sections highlighting transportation initiatives and manually labeled each of the text segments with one of 21 policy types. They then created a spreadsheet organizing the cities into the four clusters. Finally, they examined the outcome to see whether there were clear patterns within and across clusters in terms of the types of policies they prioritize.
“We found strikingly clear patterns in the types of transportation policies adopted within city clusters and clear differences across clusters,” says Moody. “That reinforced our hypothesis that different motorization and urbanization trajectories would be reflected in very different policy priorities.”
Here are some highlights of the policy priorities within the clusters.
The cities in Cluster 1 have urban rail systems and are starting to consider policies around them. For example, how can they better connect their rail systems with other transportation modes — for instance, by taking steps to integrate them with buses or with walking infrastructure? How can they plan their land use and urban development to be more transit-oriented, such as by providing mixed-use development around the existing rail network?
Cluster 2 cities are building urban rail systems, but they’re generally not yet thinking about other policies that can come with rail development. They could learn from Cluster 1 cities about other factors to take into account at the outset. For example, they could develop their urban rail with issues of multi-modality and of transit-oriented development in mind.
In Cluster 3 cities, policies tend to emphasize electrifying buses and providing improved and expanded bus service. In these cities with no rail networks, the focus is on making buses work better.
Cluster 4 cities are still focused on road development, even within their urban areas. Policy priorities often emphasize connecting the urban core to rural areas and to adjacent cities — steps that will give their populations access to the region as a whole, expanding the opportunities available to them.
Benefits of a “mixed method” approach
Results of the researchers’ analysis thus support their initial hypothesis. “Different urbanization and motorization trends that we captured in the clustering analysis are reflective of very different transportation priorities,” says Moody. “That match means we can use this approach for further policymaking analysis.”
At the outset, she viewed their study as a “proof of concept” for performing transportation policy studies using a mixed-method approach. Mixed-method research involves a blending of quantitative and qualitative approaches. In their case, the former was the mathematical analysis of time series data, and the latter was the in-depth review of city government reports to identify transportation policy priorities. “Mixed-method research is a growing area of interest, and it’s a powerful and valuable tool,” says Moody.
She did, however, find the experience of combining the quantitative and qualitative work challenging. “There weren’t many examples of people doing something similar, and that meant that we had to make sure that our quantitative work was defensible, that our qualitative work was defensible, and that the combination of them was defensible and meaningful,” she says.
The results of their work confirm that their novel analytical framework could be used in other large, rapidly developing countries with heterogeneous urban areas. “It’s probable that if you were to do this type of analysis for cities in, say, India, you might get a different number of city types, and those city types could be very different from what we got in China,” says Moody. Regardless of the setting, the capabilities provided by this kind of mixed method framework should prove increasingly important as more and more cities around the world begin innovating and learning from one another how to shape sustainable urban transportation systems.
This research was supported by the MIT Energy Initiative’s Mobility of the Future study. Information about the study, its participants and supporters, and its publications is available at energy.mit.edu/research/mobilityofthefuture.