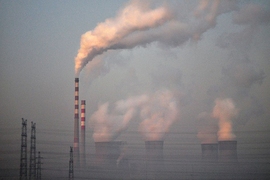
In January 2013, many people in Beijing experienced a multiweek period of severely degraded air, known colloquially as the “Airpocalypse,” which made them sick and kept them indoors. As part of its response, the central Chinese government accelerated implementation of tougher air pollution standards for power plants, with limits to take effect in July 2014. One key standard limited emissions of sulfur dioxide (SO2), which contributes to the formation of airborne particulate pollution and can cause serious lung and heart problems. The limits were introduced nationwide, but varied by location. Restrictions were especially stringent in certain “key” regions, defined as highly polluted and populous areas in Greater Beijing, the Pearl River Delta, and the Yangtze River Delta.
All power plants had to meet the new standards by July 2014. So how did they do? “In most developing countries, there are policies on the books that look very similar to policies elsewhere in the world,” says Valerie J. Karplus, an assistant professor of global economics and management at the MIT Sloan School of Management. “But there have been few attempts to look systematically at plants’ compliance with environmental regulation. We wanted to understand whether policy actually changes behavior.”
Focus on power plants
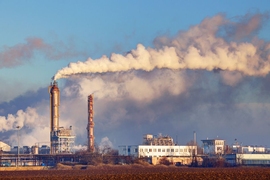
For China, focusing environmental policies on power plants makes sense. Fully 60 percent of the country’s primary energy use is coal, and about half of it is used to generate electricity. With that use comes a range of pollutant emissions. In 2007, China’s Ministry of Environmental Protection required thousands of power plants to install continuous emissions monitoring systems (CEMS) on their exhaust stacks and to upload hourly, pollutant-specific concentration data to a publicly available website.
Among the pollutants tracked on the website was SO2. To Karplus and two colleagues — Shuang Zhang, an assistant professor of economics at the University of Colorado at Boulder, and Douglas Almond, a professor in the School of International and Public Affairs and the Department of Economics at Columbia University — the CEMS data on SO2 emissions were an as-yet-untapped resource for exploring the on-the-ground impacts of the 2014 emissions standards, over time and plant-by-plant.
To begin their study, Karplus, Zhang, and Almond examined changes in the CEMS data around July 2014, when the new regulations went into effect. Their study sample included 256 power plants in four provinces, among them 43 that they deemed “large,” with a generating capacity greater than 1,000 megawatts (MW). They examined the average monthly SO2 concentrations reported by each plant starting in November 2013, eight months before the July 2014 policy deadline.
Emissions levels from the 256 plants varied considerably. The researchers were interested in relative changes within individual facilities before and after the policy, so they determined changes relative to each plant’s average emissions — a calculation known as demeaning. For each plant, they calculated the average emissions level over the whole time period being considered. They then calculated how much that plant’s reading for each month was above or below that baseline. By taking the averages of those changes-from-baseline numbers at all plants in each month, they could see how much emissions from the group of plants changed over time.
The demeaned CEMS concentrations are plotted in the first accompanying graph, labeled “SO2 concentrations (demeaned).” At zero on the Y axis in Figure 1 in the slideshow above, levels at all plants — big emitters and small — are on average equal to their baseline. Accordingly, in January 2014 plants were well above their baseline, and by July 2016 they were well below it. So average plant-level SO2 concentrations were declining slightly before the July 2014 compliance deadline, but they dropped far more dramatically after it.
Checking the reported data
Based on the CEMS data from all the plants, the researchers calculated that total SO2 emissions fell by 13.9 percent in response to the imposition of the policy in 2014. “That’s a substantial reduction,” notes Karplus. “But are those reported CEMS readings accurate?”
To find out, she, Zhang, and Almond compared the measured CEMS concentrations with SO2 concentrations detected in the atmosphere by NASA’s Ozone Monitoring Instrument. “We believed that the satellite data could provide a kind of independent check on the policy response as captured by the CEMS measurements,” she says.
For the comparison, they limited the analysis to their 43 1,000-MW power plants — large plants that should generate the strongest signal in the satellite observations. Figure 2 in the slideshow above shows data from both the CEMS and the satellite sources. Patterns in the two measures are similar, with substantial declines in the months just before and after July 2014. That general agreement suggests that the CEMS measurements can serve as a good proxy for atmospheric concentrations of SO2.
To double-check that outcome, the researchers selected 35 relatively isolated power plants whose capacity makes up at least half of the total capacity of all plants within a 35-kilometer radius. Using that restricted sample, they again compared the CEMS measurements and the satellite data. They found that the new emissions standards reduced both SO2 measures. However, the SO2 concentrations in the CEMS data fell by 36.8 percent after the policy, while concentrations in the satellite data fell by only 18.3 percent. So the CEMS measurements showed twice as great a reduction as the satellite data did. Further restricting the sample to isolated power plants with capacity larger than 1,000 MW produced similar results.
Key versus non-key regions
One possible explanation for the mismatch between the two datasets is that some firms overstated the reductions in their CEMS measurements. The researchers hypothesized that the difficulty of meeting targets would be higher in key regions, which faced the biggest cuts. In non-key regions, the limit fell from 400 to 200 milligrams per cubic meter (mg/m3). But in key regions, the limit went from 400 to 50 mg/m3. Firms may have been unable to make such a dramatic reduction in so short a time, so the incentive to manipulate their CEMS readings may have increased. For example, they may have put monitors on only a few of all their exhaust stacks, or turned monitors off during periods of high emissions.
Figure 3 in the slideshow above shows results from analyzing non-key and key regions separately. At large, isolated plants in non-key regions, the CEMS measurements show a 29.3 percent reduction in SO2 and the satellite data a 22.7 percent reduction. The ratio of the estimated post-policy declines is 77 percent — not too far out of line.
But a comparable analysis of large, isolated plants in key regions produced very different results. The CEMS measurements showed a 53.6 percent reduction in SO2, while the satellite data showed no statistically significant change at all.
One possible explanation is that power plants actually did decrease their SO2 emissions after 2014, but at the same time nearby industrial facilities or other sources increased theirs, with the net effect being that the satellite data showed little or no change. However, the researchers examined emissions from neighboring high-emitting facilities during the same time period and found no contemporaneous jump in their SO2 emissions. With that possibility dismissed, they concluded that manipulation of the CEMS data in regions facing the toughest emissions standards was “plausible,” says Karplus.
Compliance with the new standards
Another interesting question was how often the reported CEMS emissions levels were within the regulated limits. The researchers calculated the compliance rate at individual plants — that is, the fraction of time their emissions were at or below their limits — in non-key and key regions, based on their reported CEMS measurements. The results appear in Figure 4 in the slideshow above. In non-key regions, the compliance rate at all plants was about 90 percent in early 2014. It dropped a little in July 2014, when plants had to meet their (somewhat) stricter limits, and then went back up to almost 100 percent. In contrast, the compliance rate in key regions was almost 100 percent in early 2014 and then plummeted to about 50 percent at and after July 2014.
Karplus, Zhang, and Almond interpret that result as an indication of the toughness of complying with the stringent new standards. “If you think about it from the plant’s perspective, complying with tighter standards is a lot harder than complying with more lenient standards, especially if plants have recently made investments to comply with prior standards, but those changes are no longer adequate,” she says. “So in these key regions, many plants fell out of compliance.”
She makes another interesting observation. Their analyses had already produced evidence that firms in key areas may have falsified their reported CEMS measurements. “So that means they could be both manipulating their data and complying less,” she says.
Encouraging results plus insights for policymaking
Karplus stresses the positive outcomes of their study. She’s encouraged that the CEMS and satellite data both show emission levels dropping at most plants. Compliance rates were down at some plants in key regions, but that’s not surprising when the required cuts were large. And she notes that even though firms may not have complied, they still reduced their emissions to some extent as a result of the new standard.
She also observes that, for the most part, there’s close correlation between the CEMS and satellite data. So the quality of the CEMS data isn’t all bad. And where it’s bad — where firms may have manipulated their measurements — it may have been because they’d been set a seemingly impossible task and timeline. “At some point, plant managers might just throw up their hands,” says Karplus. The lesson for policymakers may be to set emissions-reduction goals that are deep but long-term so that firms have enough time to make the necessary investment and infrastructure adjustments.
To Karplus, an important practical implication of the study is “demonstrating that you can look at the alignment between ground and remote data sources to evaluate the impact of specific policies.” A series of tests confirmed the validity of their method and the robustness of their results. For example, they performed a comparable analysis focusing on July 2015, when there was no change in emissions standards. There was no evidence of the same effects. They accounted for SO2 emitted by manufacturing facilities and other sources, and their results were unaffected. And they demonstrated that when clouds or other obstructions interfered with satellite observations, the resulting data gap had no impact on their results.
The researchers note that their approach can be used for other short-lived industrial air pollutants and by any country seeking low-cost tools to improve data quality and policy compliance, especially when plants’ emissions are high to begin with. “Our work provides an illustration of how you can use satellite data to obtain an independent check on emissions from pretty much any high-emitting facility,” says Karplus. “And, over time, NASA will have instruments that can take measurements that are even more temporally and spatially resolved, which I think is quite exciting for environmental protection agencies and for those who would seek to improve the environmental performance of their energy assets.”
This research was supported by a seed grant from the Samuel Tak Lee Real Estate Entrepreneurship Laboratory at MIT and by the U.S. National Science Foundation.
This article appears in the Autumn 2019 issue of Energy Futures, the magazine of the MIT Energy Initiative.