

A growing portion of Americans who are struggling to pay for their household energy live in the South and Southwest, reflecting a climate-driven shift away from heating needs and toward air conditioning use, an MIT study finds.
The newly published research also reveals that a major U.S. federal program that provides energy subsidies to households, by assigning block grants to states, does not yet fully match these recent trends.
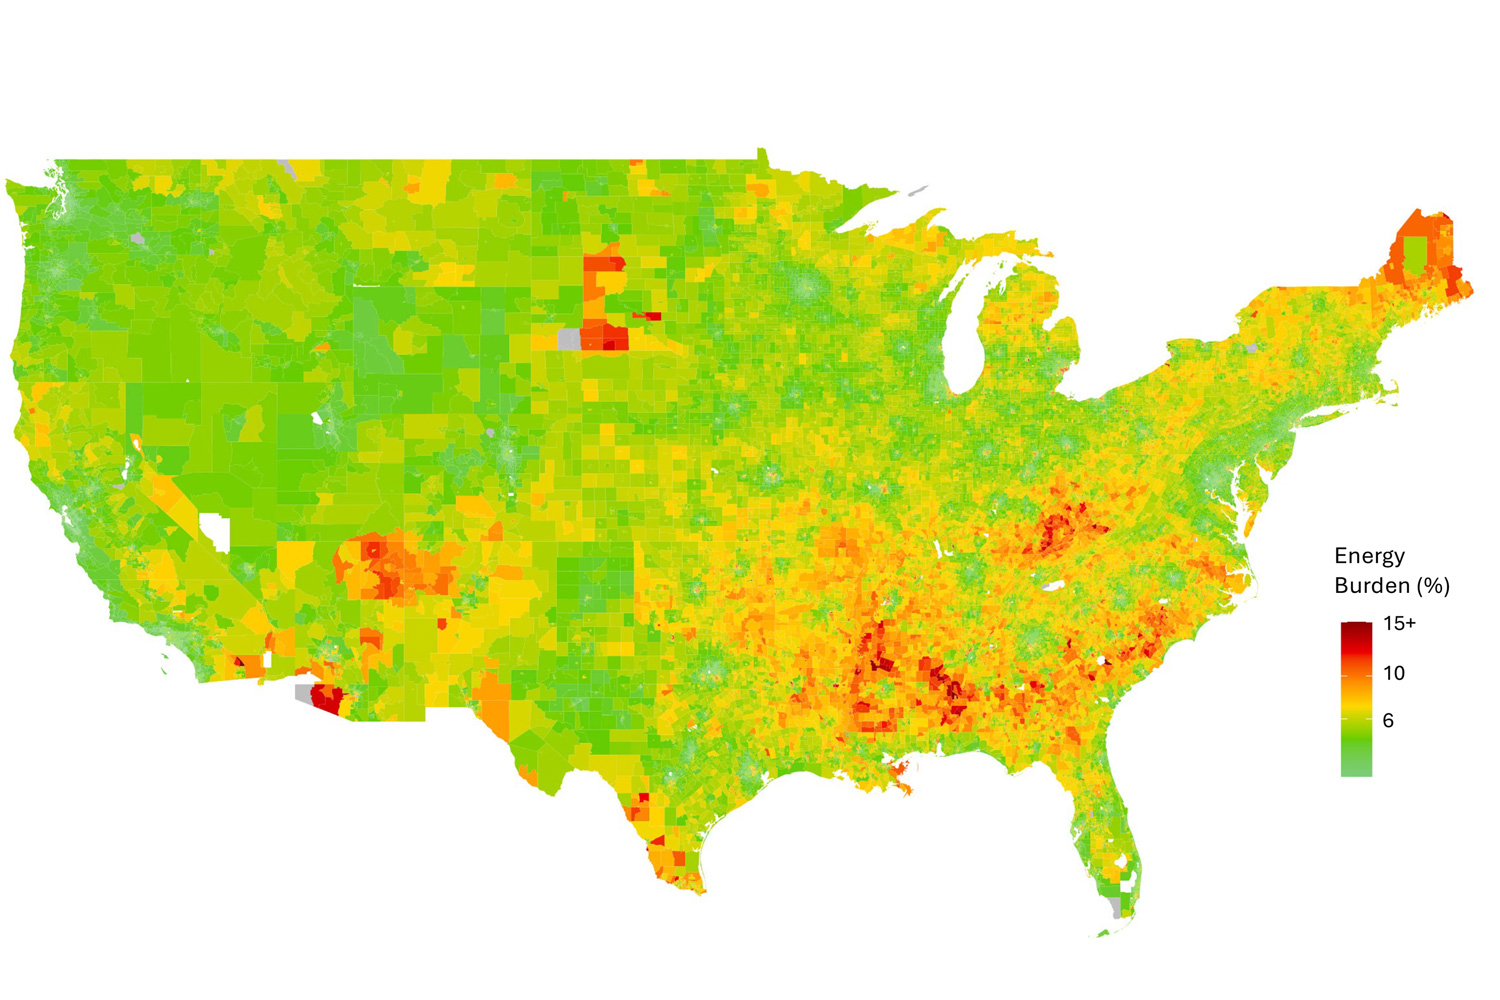
The work evaluates the “energy burden” on households, which reflects the percentage of income needed to pay for energy necessities, from 2015 to 2020. Households with an energy burden greater than 6 percent of income are considered to be in “energy poverty.” With climate change, rising temperatures are expected to add financial stress in the South, where air conditioning is increasingly needed. Meanwhile, milder winters are expected to reduce heating costs in some colder regions.
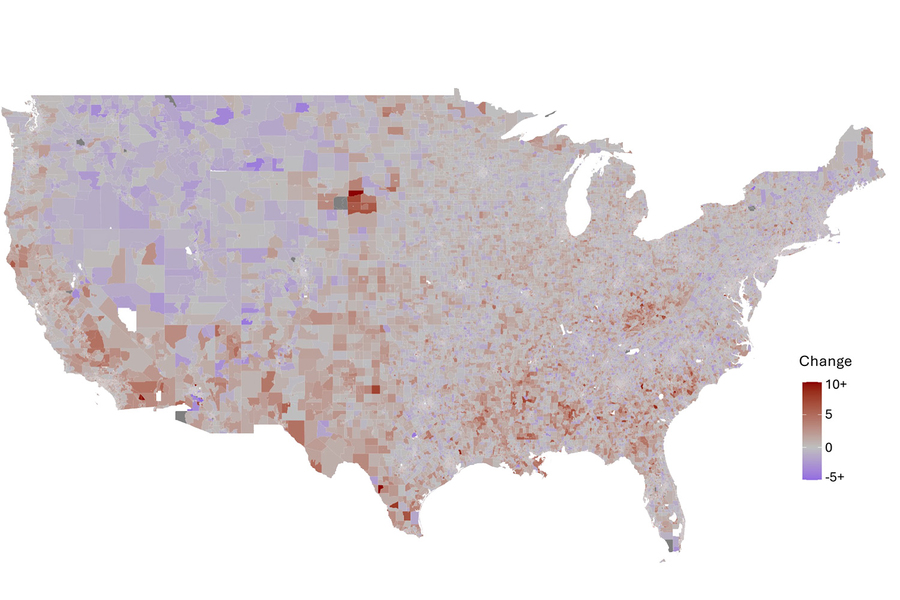
“From 2015 to 2020, there is an increase in burden generally, and you do also see this southern shift,” says Christopher Knittel, an MIT energy economist and co-author of a new paper detailing the study’s results. About federal aid, he adds, “When you compare the distribution of the energy burden to where the money is going, it’s not aligned too well.”
The paper, “U.S. federal resource allocations are inconsistent with concentrations of energy poverty,” is published today in Science Advances.
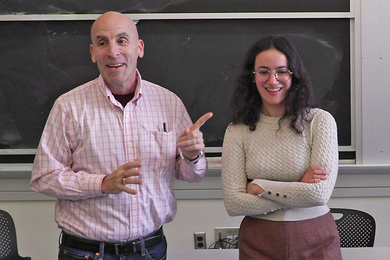
The authors are Carlos Batlle, a professor at Comillas University in Spain and a senior lecturer with the MIT Energy Initiative; Peter Heller SM ’24, a recent graduate of the MIT Technology and Policy Program; Knittel, the George P. Shultz Professor at the MIT Sloan School of Management and associate dean for climate and sustainability at MIT; and Tim Schittekatte, a senior lecturer at MIT Sloan.
A scorching decade
The study, which grew out of graduate research that Heller conducted at MIT, deploys a machine-learning estimation technique that the scholars applied to U.S. energy use data.
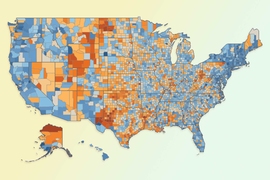
Specifically, the researchers took a sample of about 20,000 households from the U.S. Energy Information Administration’s Residential Energy Consumption Survey, which includes a wide variety of demographic characteristics about residents, along with building-type and geographic information. Then, using the U.S. Census Bureau’s American Community Survey data for 2015 and 2020, the research team estimated the average household energy burden for every census tract in the lower 48 states — 73,057 in 2015, and 84,414 in 2020.
That allowed the researchers to chart the changes in energy burden in recent years, including the shift toward a greater energy burden in southern states. In 2015, Maine, Mississippi, Arkansas, Vermont, and Alabama were the five states (ranked in descending order) with the highest energy burden across census bureau tracts. In 2020, that had shifted somewhat, with Maine and Vermont dropping on the list and southern states increasingly having a larger energy burden. That year, the top five states in descending order were Mississippi, Arkansas, Alabama, West Virginia, and Maine.
The data also reflect a urban-rural shift. In 2015, 23 percent of the census tracts where the average household is living in energy poverty were urban. That figure shrank to 14 percent by 2020.
All told, the data are consistent with the picture of a warming world, in which milder winters in the North, Northwest, and Mountain West require less heating fuel, while more extreme summer temperatures in the South require more air conditioning.
“Who’s going to be harmed most from climate change?” asks Knittel. “In the U.S., not surprisingly, it’s going to be the southern part of the U.S. And our study is confirming that, but also suggesting it’s the southern part of the U.S that’s least able to respond. If you’re already burdened, the burden’s growing.”
An evolution for LIHEAP?
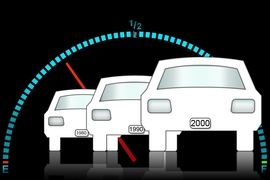
In addition to identifying the shift in energy needs during the last decade, the study also illuminates a longer-term change in U.S. household energy needs, dating back to the 1980s. The researchers compared the present-day geography of U.S. energy burden to the help currently provided by the federal Low Income Home Energy Assistance Program (LIHEAP), which dates to 1981.
Federal aid for energy needs actually predates LIHEAP, but the current program was introduced in 1981, then updated in 1984 to include cooling needs such as air conditioning. When the formula was updated in 1984, two “hold harmless” clauses were also adopted, guaranteeing states a minimum amount of funding.
Still, LIHEAP’s parameters also predate the rise of temperatures over the last 40 years, and the current study shows that, compared to the current landscape of energy poverty, LIHEAP distributes relatively less of its funding to southern and southwestern states.
“The way Congress uses formulas set in the 1980s keeps funding distributions nearly the same as it was in the 1980s,” Heller observes. “Our paper illustrates the shift in need that has occurred over the decades since then.”
Currently, it would take a fourfold increase in LIHEAP to ensure that no U.S. household experiences energy poverty. But the researchers tested out a new funding design, which would help the worst-off households first, nationally, ensuring that no household would have an energy burden of greater than 20.3 percent.
“We think that’s probably the most equitable way to allocate the money, and by doing that, you now have a different amount of money that should go to each state, so that no one state is worse off than the others,” Knittel says.
And while the new distribution concept would require a certain amount of subsidy reallocation among states, it would be with the goal of helping all households avoid a certain level of energy poverty, across the country, at a time of changing climate, warming weather, and shifting energy needs in the U.S.
“We can optimize where we spend the money, and that optimization approach is an important thing to think about,” Knittel says.