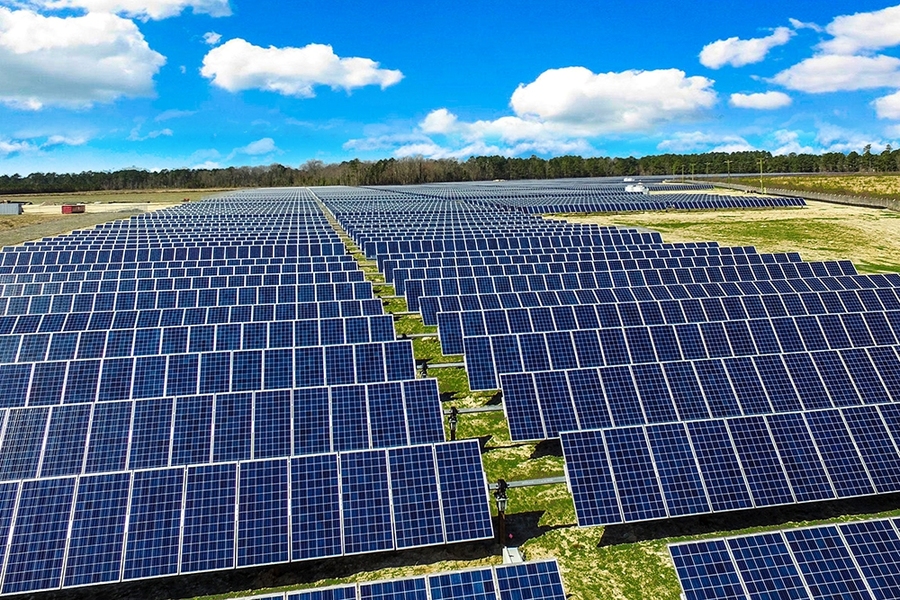
Over the past decade, the cost of solar photovoltaic (PV) arrays has fallen rapidly. But at the same time, the value of PV power has declined in areas that have installed significant PV generating capacity. Operators of utility-scale PV systems have seen electricity prices drop as more PV generators come online. Over the same time period, many coal-fired power plants were required to install emissions-control systems, resulting in declines in air pollution nationally and regionally. The result has been improved public health — but also a decrease in the potential health benefits from offsetting coal generation with PV generation.
Given those competing trends, do the benefits of PV generation outweigh the costs? Answering that question requires balancing the up-front capital costs against the lifetime benefits of a PV system. Determining the former is fairly straightforward. But assessing the latter is challenging because the benefits differ across time and place. “The differences aren’t just due to variation in the amount of sunlight a given location receives throughout the year,” says Patrick R. Brown PhD ’16, a postdoc at the MIT Energy Initiative. “They’re also due to variability in electricity prices and pollutant emissions.”
The drop in the price paid for utility-scale PV power stems in part from how electricity is bought and sold on wholesale electricity markets. On the “day-ahead” market, generators and customers submit bids specifying how much they’ll sell or buy at various price levels at a given hour on the following day. The lowest-cost generators are chosen first. Since the variable operating cost of PV systems is near zero, they’re almost always chosen, taking the place of the most expensive generator then in the lineup. The price paid to every selected generator is set by the highest-cost operator on the system, so as more PV power comes on, more high-cost generators come off, and the price drops for everyone. As a result, in the middle of the day, when solar is generating the most, prices paid to electricity generators are at their lowest.
Brown notes that some generators may even bid negative prices. “They’re effectively paying consumers to take their power to ensure that they are dispatched,” he explains. For example, inflexible coal and nuclear plants may bid negative prices to avoid frequent shutdown and startup events that would result in extra fuel and maintenance costs. Renewable generators may also bid negative prices to obtain larger subsidies that are rewarded based on production.
Health benefits also differ over time and place. The health effects of deploying PV power are greater in a heavily populated area that relies on coal power than in a less-populated region that has access to plenty of clean hydropower or wind. And the local health benefits of PV power can be higher when there’s congestion on transmission lines that leaves a region stuck with whatever high-polluting sources are available nearby. The social costs of air pollution are largely “externalized,” that is, they are mostly unaccounted for in electricity markets. But they can be quantified using statistical methods, so health benefits resulting from reduced emissions can be incorporated when assessing the cost-competitiveness of PV generation.
The contribution of fossil-fueled generators to climate change is another externality not accounted for by most electricity markets. Some U.S. markets, particularly in California and the Northeast, have implemented cap-and-trade programs, but the carbon dioxide (CO2) prices in those markets are much lower than estimates of the social cost of CO2, and other markets don’t price carbon at all. A full accounting of the benefits of PV power thus requires determining the CO2 emissions displaced by PV generation and then multiplying that value by a uniform carbon price representing the damage that those emissions would have caused.
Calculating PV costs and benefits
To examine the changing value of solar power, Brown and his colleague Francis M. O’Sullivan, the senior vice president of strategy at Ørsted Onshore North America and a senior lecturer at the MIT Sloan School of Management, developed a methodology to assess the costs and benefits of PV power across the U.S. power grid annually from 2010 to 2017.
The researchers focused on six “independent system operators” (ISOs) in California, Texas, the Midwest, the Mid-Atlantic, New York, and New England. Each ISO sets electricity prices at hundreds of “pricing nodes” along the transmission network in their region. The researchers performed analyses at more than 10,000 of those pricing nodes.
For each node, they simulated the operation of a utility-scale PV array that tilts to follow the sun throughout the day. They calculated how much electricity it would generate and the benefits that each kilowatt would provide, factoring in energy and “capacity” revenues as well as avoided health and climate change costs associated with the displacement of fossil fuel emissions. (Capacity revenues are paid to generators for being available to deliver electricity at times of peak demand.) They focused on emissions of CO2, which contributes to climate change, and of nitrogen oxides (NOx), sulfur dioxide (SO2), and particulate matter called PM2.5 — fine particles that can cause serious health problems and can be emitted or formed in the atmosphere from NOx and SO2.
The results of the analysis showed that the wholesale energy value of PV generation varied significantly from place to place, even within the region of a given ISO. For example, in New York City and Long Island, where population density is high and adding transmission lines is difficult, the market value of solar was at times 50 percent higher than across the state as a whole.
The public health benefits associated with SO2, NOx, and PM2.5 emissions reductions declined over the study period but were still substantial in 2017. Monetizing the health benefits of PV generation in 2017 would add almost 75 percent to energy revenues in the Midwest and New York and fully 100 percent in the Mid-Atlantic, thanks to the large amount of coal generation in the Midwest and Mid-Atlantic and the high population density on the Eastern Seaboard.
Based on the calculated energy and capacity revenues and health and climate benefits for 2017, the researchers asked: Given that combination of private and public benefits, what upfront PV system cost would be needed to make the PV installation “break even” over its lifetime, assuming that grid conditions in that year persist for the life of the installation? In other words, says Brown, “At what capital cost would an investment in a PV system be paid back in benefits over the lifetime of the array?”
Assuming 2017 values for energy and capacity market revenues alone, an unsubsidized PV investment at 2017 costs doesn’t break even. Add in the health benefit, and PV breaks even at 30 percent of the pricing nodes modeled. Assuming a carbon price of $50 per ton, the investment breaks even at about 70 percent of the nodes, and with a carbon price of $100 per ton (which is still less than the price estimated to be needed to limit global temperature rise to under 2 degrees Celsius), PV breaks even at all of the modeled nodes.
That wasn’t the case just two years earlier: At 2015 PV costs, PV would only have broken even in 2017 at about 65 percent of the nodes counting market revenues, health benefits, and a $100 per ton carbon price. “Since 2010, solar has gone from one of the most expensive sources of electricity to one of the cheapest, and it now breaks even across the majority of the U.S. when considering the full slate of values that it provides,” says Brown.
Based on their findings, the researchers conclude that the decline in PV costs over the studied period outpaced the decline in value, such that in 2017 the market, health, and climate benefits outweighed the cost of PV systems at the majority of locations modeled. “So the amount of solar that’s competitive is still increasing year by year,” says Brown.
The findings underscore the importance of considering health and climate benefits as well as market revenues. “If you’re going to add another megawatt of PV power, it’s best to put it where it’ll make the most difference, not only in terms of revenues but also health and CO2,” says Brown.
Unfortunately, today’s policies don’t reward that behavior. Some states do provide renewable energy subsidies for solar investments, but they reward generation equally everywhere. Yet in states such as New York, the public health benefits would have been far higher at some nodes than at others. State-level or regional reward mechanisms could be tailored to reflect such variation in node-to-node benefits of PV generation, providing incentives for installing PV systems where they’ll be most valuable. Providing time-varying price signals (including the cost of emissions) not only to utility-scale generators, but also to residential and commercial electricity generators and customers, would similarly guide PV investment to areas where it provides the most benefit.
Time-shifting PV output to maximize revenues
The analysis provides some guidance that might help would-be PV installers maximize their revenues. For example, it identifies certain “hot spots” where PV generation is especially valuable. At some high-electricity-demand nodes along the East Coast, for instance, persistent grid congestion has meant that the projected revenue of a PV generator has been high for more than a decade. The analysis also shows that the sunniest site may not always be the most profitable choice. A PV system in Texas would generate about 20 percent more power than one in the Northeast, yet energy revenues were greater at nodes in the Northeast than in Texas in some of the years analyzed.
To help potential PV owners maximize their future revenues, Brown and O’Sullivan performed a follow-on study focusing on ways to shift the output of PV arrays to align with times of higher prices on the wholesale market. For this analysis, they considered the value of solar on the day-ahead market and also on the “real-time market,” which dispatches generators to correct for discrepancies between supply and demand. They explored three options for shaping the output of PV generators, with a focus on the California real-time market in 2017, when high PV penetration led to a large reduction in midday prices compared to morning and evening prices.
- Curtailing output when prices are negative: During negative-price hours, a PV operator can simply turn off generation. In California in 2017, curtailment would have increased revenues by 9 percent on the real-time market compared to “must-run” operation.
- Changing the orientation of “fixed-tilt” (stationary) solar panels: The general rule of thumb in the Northern Hemisphere is to orient solar panels toward the south, maximizing production over the year. But peak production then occurs at about noon, when electricity prices in markets with high solar penetration are at their lowest. Pointing panels toward the west moves generation further into the afternoon. On the California real-time market in 2017, optimizing the orientation would have increased revenues by 13 percent, or 20 percent in conjunction with curtailment.
- Using 1-axis tracking: For larger utility-scale installations, solar panels are frequently installed on automatic solar trackers, rotating throughout the day from east in the morning to west in the evening. Using such 1-axis tracking on the California system in 2017 would have increased revenues by 32 percent over a fixed-tilt installation, and using tracking plus curtailment would have increased revenues by 42 percent.
The researchers were surprised to see how much the optimal orientation changed in California over the period of their study. “In 2010, the best orientation for a fixed array was about 10 degrees west of south,” says Brown. “In 2017, it’s about 55 degrees west of south.” That adjustment is due to changes in market prices that accompany significant growth in PV generation — changes that will occur in other regions as they start to ramp up their solar generation.
The researchers stress that conditions are constantly changing on power grids and electricity markets. With that in mind, they made their database and computer code openly available so that others can readily use them to calculate updated estimates of the net benefits of PV power and other distributed energy resources.
They also emphasize the importance of getting time-varying prices to all market participants and of adapting installation and dispatch strategies to changing power system conditions. A law set to take effect in California in 2020 will require all new homes to have solar panels. Installing the usual south-facing panels with uncurtailable output could further saturate the electricity market at times when other PV installations are already generating.
“If new rooftop arrays instead use west-facing panels that can be switched off during negative price times, it’s better for the whole system,” says Brown. “Rather than just adding more solar at times when the price is already low and the electricity mix is already clean, the new PV installations would displace expensive and dirty gas generators in the evening. Enabling that outcome is a win all around.”
Patrick Brown and this research were supported by a U.S. Department of Energy Office of Energy Efficiency and Renewable Energy (EERE) Postdoctoral Research Award through the EERE Solar Energy Technologies Office. The computer code and data repositories are available here and here.
This article appears in the Spring 2020 issue of Energy Futures, the magazine of the MIT Energy Initiative.


