Explained: Carbon credits
Can carbon trading systems reduce global emissions, or are they little more than greenwashing? Clear, enforceable standards may make the difference.
Can carbon trading systems reduce global emissions, or are they little more than greenwashing? Clear, enforceable standards may make the difference.
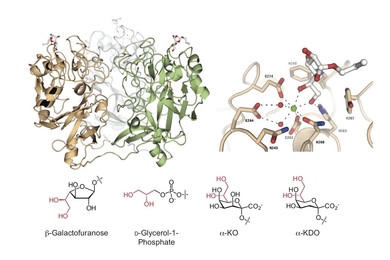
Researchers are working to advance the field of glycoscience, illuminating the essential role of carbohydrates for human health and disease.

After a summer of weather extremes, where does the world stand in its goal to stem rising temps?

“Interpretability methods” seek to shed light on how machine-learning models make predictions, but researchers say to proceed with caution.

Many years of research have enabled scientists to quickly synthesize RNA vaccines and deliver them inside cells.

Quantum computers could usher in a golden age of computing power, solving problems intractable on today’s machines.

Concrete is the world’s most consumed construction material. Yet there’s a lot the public doesn’t know about it or its environmental impact.

Professor of nuclear science and engineering Scott Kemp describes the science behind the search for clandestine nuclear sites.

Ballyhooed artificial-intelligence technique known as “deep learning” revives 70-year-old idea.

Carbon dioxide isn’t the only one that matters, and the gases vary widely in potency and duration.

Technique enables production of pure, uniform coatings of metals or polymers, even on contoured surfaces.

Better understanding of how surfaces attract or repel water could improve everything from power plants to ketchup bottles.
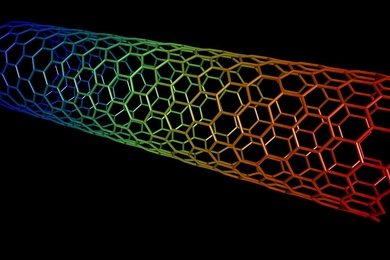
Tiny filaments and cylinders are studied for possible uses in energy, electronics, optics and other fields.

A simple tool for representing relationships between data, devices or almost anything else has ubiquitous applications in computer science.