
Game on
As MIT Sloan Sports Analytics Conference kicks off, scholars and fans have produced a growing avalanche of quantitative research.
As MIT Sloan Sports Analytics Conference kicks off, scholars and fans have produced a growing avalanche of quantitative research.

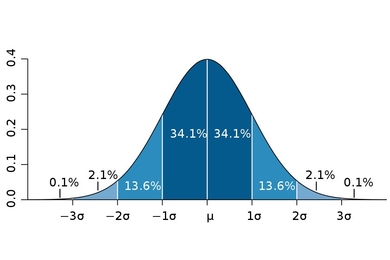
How do you know when a new finding is significant? The sigma value can tell you — but watch out for dead fish.

A new technique for finding relationships between variables in large datasets makes no prior assumptions about what those relationships might be.

With knowledge and data, a smarter world will divide work between computers and humans, search engine executive chairman says.
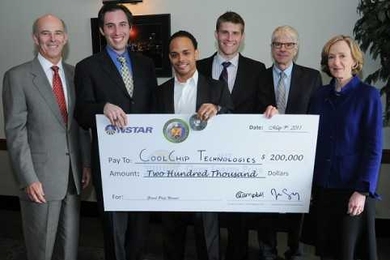
Institute ideas win $200K top prize and all five finalist prizes, with variety of energy solutions.

At MIT’s annual sports analytics conference, owners, coaches and statistics mavens convene to ask how numbers can help increase success.

Charles Leiserson and his team are experts at designing parallel algorithms — including one for a chess-playing program that outperformed IBM’s Deep Blue.

A new system automatically combs through online reviews to provide recommendations according to unusual criteria.
Delivers Abramowitz Memorial Lecture, hosted by MIT Office of the Arts

MBA student Peljto turns passion into projects; works behind the scenes on the sports analytics conference.

To protect the personal data MIT collects and to comply with new Massachusetts regulations, a campus-wide Written Information Security Program (WISP) has been developed.