For most people, reading about the difference between a global average temperature rise of 1.5 C versus 2 C doesn’t conjure up a clear image of how their daily lives will actually be affected. So, researchers at MIT have come up with a different way of measuring and describing what global climate change patterns, in specific regions around the world, will mean for people’s daily activities and their quality of life.
The new measure, called “outdoor days,” describes the number of days per year that outdoor temperatures are neither too hot nor too cold for people to go about normal outdoor activities, whether work or leisure, in reasonable comfort. Describing the impact of rising temperatures in those terms reveals some significant global disparities, the researchers say.
The findings are described in a research paper written by MIT professor of civil and environmental engineering Elfatih Eltahir and postdocs Yeon-Woo Choi and Muhammad Khalifa, and published in the Journal of Climate.
Eltahir says he got the idea for this new system during his hourlong daily walks in the Boston area. “That’s how I interface with the temperature every day,” he says. He found that there have been more winter days recently when he could walk comfortably than in past years. Originally from Sudan, he says that when he returned there for visits, the opposite was the case: In winter, the weather tends to be relatively comfortable, but the number of these clement winter days has been declining. “There are fewer days that are really suitable for outdoor activity,” Eltahir says.
Rather than predefine what constitutes an acceptable outdoor day, Eltahir and his co-authors created a website where users can set their own definition of the highest and lowest temperatures they consider comfortable for their outside activities, then click on a country within a world map, or a state within the U.S., and get a forecast of how the number of days meeting those criteria will change between now and the end of this century. The website is freely available for anyone to use.
“This is actually a new feature that’s quite innovative,” he says. “We don’t tell people what an outdoor day should be; we let the user define an outdoor day. Hence, we invite them to participate in defining how future climate change will impact their quality of life, and hopefully, this will facilitate deeper understanding of how climate change will impact individuals directly.”
After deciding that this was a way of looking at the issue of climate change that might be useful, Eltahir says, “we started looking at the data on this, and we made several discoveries that I think are pretty significant.”
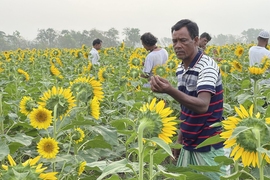
First of all, there will be winners and losers, and the losers tend to be concentrated in the global south. “In the North, in a place like Russia or Canada, you gain a significant number of outdoor days. And when you go south to places like Bangladesh or Sudan, it’s bad news. You get significantly fewer outdoor days. It is very striking.”
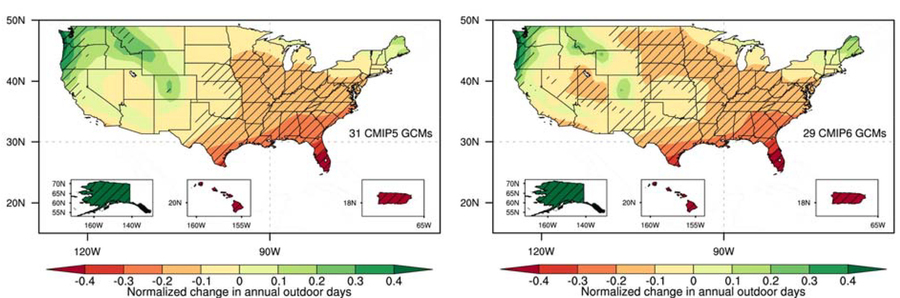
To derive the data, the software developed by the team uses all of the available climate models, about 50 of them, and provides output showing all of those projections on a single graph to make clear the range of possibilities, as well as the average forecast.
When we think of climate change, Eltahir says, we tend to look at maps that show that virtually everywhere, temperatures will rise. “But if you think in terms of outdoor days, you see that the world is not flat. The North is gaining; the South is losing.”
While North-South disparity in exposure and vulnerability has been broadly recognized in the past, he says, this way of quantifying the effects on the hazard (change in weather patterns) helps to bring home how strong the uneven risks from climate change on quality of life will be. “When you look at places like Bangladesh, Colombia, Ivory Coast, Sudan, Indonesia — they are all losing outdoor days.”
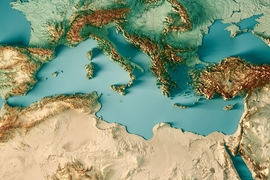
The same kind of disparity shows up in Europe, he says. The effects are already being felt, and are showing up in travel patterns: “There is a shift to people spending time in northern European states. They go to Sweden and places like that instead of the Mediterranean, which is showing a significant drop,” he says.
Placing this kind of detailed and localized information at people’s fingertips, he says, “I think brings the issue of communication of climate change to a different level.” With this tool, instead of looking at global averages, “we are saying according to your own definition of what a pleasant day is, [this is] how climate change is going to impact you, your activities.”
And, he adds, “hopefully that will help society make decisions about what to do with this global challenge.”
The project received support from the MIT Climate Grand Challenges project “Jameel Observatory - Climate Resilience Early Warning System Network,” as well as from the Abdul Latif Jameel Water and Food Systems Lab.