On Dec. 21, 2022, just as peak holiday season travel was getting underway, Southwest Airlines went through a cascading series of failures in their scheduling, initially triggered by severe winter weather in the Denver area. But the problems spread through their network, and over the course of the next 10 days the crisis ended up stranding over 2 million passengers and causing losses of $750 million for the airline.
How did a localized weather system end up triggering such a widespread failure? Researchers at MIT have examined this widely reported failure as an example of cases where systems that work smoothly most of the time suddenly break down and cause a domino effect of failures. They have now developed a computational system for using the combination of sparse data about a rare failure event, in combination with much more extensive data on normal operations, to work backwards and try to pinpoint the root causes of the failure, and hopefully be able to find ways to adjust the systems to prevent such failures in the future.
The findings were presented at the International Conference on Learning Representations (ICLR), which was held in Singapore from April 24-28 by MIT doctoral student Charles Dawson, professor of aeronautics and astronautics Chuchu Fan, and colleagues from Harvard University and the University of Michigan.
“The motivation behind this work is that it’s really frustrating when we have to interact with these complicated systems, where it’s really hard to understand what’s going on behind the scenes that’s creating these issues or failures that we’re observing,” says Dawson.
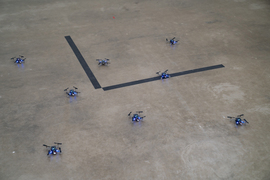
The new work builds on previous research from Fan’s lab, where they looked at problems involving hypothetical failure prediction problems, she says, such as with groups of robots working together on a task, or complex systems such as the power grid, looking for ways to predict how such systems may fail. “The goal of this project,” Fan says, “was really to turn that into a diagnostic tool that we could use on real-world systems.”
The idea was to provide a way that someone could “give us data from a time when this real-world system had an issue or a failure,” Dawson says, “and we can try to diagnose the root causes, and provide a little bit of a look behind the curtain at this complexity.”
The intent is for the methods they developed “to work for a pretty general class of cyber-physical problems,” he says. These are problems in which “you have an automated decision-making component interacting with the messiness of the real world,” he explains. There are available tools for testing software systems that operate on their own, but the complexity arises when that software has to interact with physical entities going about their activities in a real physical setting, whether it be the scheduling of aircraft, the movements of autonomous vehicles, the interactions of a team of robots, or the control of the inputs and outputs on an electric grid. In such systems, what often happens, he says, is that “the software might make a decision that looks OK at first, but then it has all these domino, knock-on effects that make things messier and much more uncertain.”
One key difference, though, is that in systems like teams of robots, unlike the scheduling of airplanes, “we have access to a model in the robotics world,” says Fan, who is a principal investigator in MIT’s Laboratory for Information and Decision Systems (LIDS). “We do have some good understanding of the physics behind the robotics, and we do have ways of creating a model” that represents their activities with reasonable accuracy. But airline scheduling involves processes and systems that are proprietary business information, and so the researchers had to find ways to infer what was behind the decisions, using only the relatively sparse publicly available information, which essentially consisted of just the actual arrival and departure times of each plane.
“We have grabbed all this flight data, but there is this entire system of the scheduling system behind it, and we don’t know how the system is working,” Fan says. And the amount of data relating to the actual failure is just several day’s worth, compared to years of data on normal flight operations.
The impact of the weather events in Denver during the week of Southwest’s scheduling crisis clearly showed up in the flight data, just from the longer-than-normal turnaround times between landing and takeoff at the Denver airport. But the way that impact cascaded though the system was less obvious, and required more analysis. The key turned out to have to do with the concept of reserve aircraft.
Airlines typically keep some planes in reserve at various airports, so that if problems are found with one plane that is scheduled for a flight, another plane can be quickly substituted. Southwest uses only a single type of plane, so they are all interchangeable, making such substitutions easier. But most airlines operate on a hub-and-spoke system, with a few designated hub airports where most of those reserve aircraft may be kept, whereas Southwest does not use hubs, so their reserve planes are more scattered throughout their network. And the way those planes were deployed turned out to play a major role in the unfolding crisis.
“The challenge is that there’s no public data available in terms of where the aircraft are stationed throughout the Southwest network,” Dawson says. “What we’re able to find using our method is, by looking at the public data on arrivals, departures, and delays, we can use our method to back out what the hidden parameters of those aircraft reserves could have been, to explain the observations that we were seeing.”
What they found was that the way the reserves were deployed was a “leading indicator” of the problems that cascaded in a nationwide crisis. Some parts of the network that were affected directly by the weather were able to recover quickly and get back on schedule. “But when we looked at other areas in the network, we saw that these reserves were just not available, and things just kept getting worse.”
For example, the data showed that Denver’s reserves were rapidly dwindling because of the weather delays, but then “it also allowed us to trace this failure from Denver to Las Vegas,” he says. While there was no severe weather there, “our method was still showing us a steady decline in the number of aircraft that were able to serve flights out of Las Vegas.”
He says that “what we found was that there were these circulations of aircraft within the Southwest network, where an aircraft might start the day in California and then fly to Denver, and then end the day in Las Vegas.” What happened in the case of this storm was that the cycle got interrupted. As a result, “this one storm in Denver breaks the cycle, and suddenly the reserves in Las Vegas, which is not affected by the weather, start to deteriorate.”
In the end, Southwest was forced to take a drastic measure to resolve the problem: They had to do a “hard reset” of their entire system, canceling all flights and flying empty aircraft around the country to rebalance their reserves.
Working with experts in air transportation systems, the researchers developed a model of how the scheduling system is supposed to work. Then, “what our method does is, we’re essentially trying to run the model backwards.” Looking at the observed outcomes, the model allows them to work back to see what kinds of initial conditions could have produced those outcomes.
While the data on the actual failures were sparse, the extensive data on typical operations helped in teaching the computational model “what is feasible, what is possible, what’s the realm of physical possibility here,” Dawson says. “That gives us the domain knowledge to then say, in this extreme event, given the space of what’s possible, what’s the most likely explanation” for the failure.
This could lead to a real-time monitoring system, he says, where data on normal operations are constantly compared to the current data, and determining what the trend looks like. “Are we trending toward normal, or are we trending toward extreme events?” Seeing signs of impending issues could allow for preemptive measures, such as redeploying reserve aircraft in advance to areas of anticipated problems.
Work on developing such systems is ongoing in her lab, Fan says. In the meantime, they have produced an open-source tool for analyzing failure systems, called CalNF, which is available for anyone to use. Meanwhile Dawson, who earned his doctorate last year, is working as a postdoc to apply the methods developed in this work to understanding failures in power networks.
The research team also included Max Li from the University of Michigan and Van Tran from Harvard University. The work was supported by NASA, the Air Force Office of Scientific Research, and the MIT-DSTA program.