Warmer weather can be a welcome change for many across the MIT community. But as climate impacts intensify, warm days are often becoming hot days with increased severity and frequency. Already this summer, heat waves in June and July brought daily highs of over 90 degrees Fahrenheit. According to the Resilient Cambridge report published in 2021, from the 1970s to 2000, data from the Boston Logan International Airport weather station reported an average of 10 days of 90-plus temperatures each year. Now, simulations are predicting that, in the current time frame of 2015-44, the number of days above 90 F could be triple the 1970-2000 average.
While the increasing heat is all but certain, how institutions like MIT will be affected and how they respond continues to evolve. “We know what the science is showing, but how will this heat impact the ability of MIT to fulfill its mission and support its community?” asks Brian Goldberg, assistant director of the MIT Office of Sustainability. “What will be the real feel of these temperatures on campus?” These questions and more are guiding staff, researchers, faculty, and students working collaboratively to understand these impacts to MIT and inform decisions and action plans in response.
This work is part of developing MIT’s forthcoming Climate Resiliency and Adaptation Roadmap, which is called for in MIT’s climate action plan, and is co-led by Goldberg; Laura Tenny, senior campus planner; and William Colehower, senior advisor to the vice president for campus services and stewardship. This effort is also supported by researchers in the departments of Urban Studies and Planning, Architecture, and Electrical Engineering and Computer Science (EECS), in the Urban Risk Lab and the Senseable City Lab, as well as by staff in MIT Emergency Management and Housing and Residential Services. The roadmap — which builds upon years of resiliency planning and research at MIT — will include an assessment of current and future conditions on campus as well as strategies and proposed interventions to support MIT’s community and campus in the face of increasing climate impacts.
A key piece of the resiliency puzzle
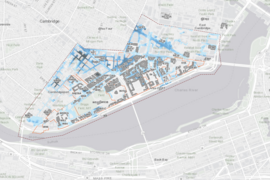
When the City of Cambridge released their Climate Change Vulnerability Assessment in 2015, the report identified flooding and heat as primary resiliency risks to the city. In response, Institute staff worked together with the city to create a full picture of potential flood risks to both Cambridge and the campus, with the latter becoming the MIT Climate Resiliency Dashboard. The dashboard, published in the MIT Sustainability DataPool, has played an important role in campus planning and resiliency efforts since its debut in 2021, but heat has been a missing piece of the tool. This is largely because for heat, unlike flooding, few data exist relative to building-level impacts. The original assessment from Cambridge showed a model of temperature averages that could be expected in portions of the city, but understanding the measured heat impacts down to the building level is essential because impacts of heat can vary so greatly. “Heat also doesn’t conform to topography like flooding, making it harder to map it with localized specificity,” notes Tenny. “Microclimates, humidity levels, shade or sun aspect, and other factors contribute to heat risk.”
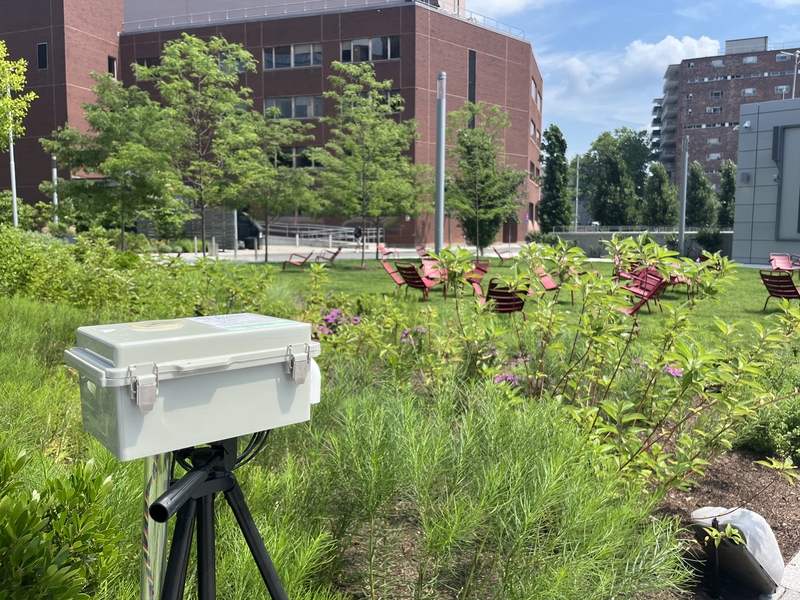
Collection efforts have been underway for the past three years to fill in this gap in baseline data. Members of the Climate and Resiliency Adaptation Roadmap team and partners have helped build and place heat sensors to record and analyze data. The current heat sensors, which are shoebox-shaped devices on tripods, can be found at multiple outdoor locations on campus during the summer, capturing and recording temperatures multiple times each hour. “Urban environmental phenomena are hyperlocal. While National Weather Service readouts at locations like Logan Airport are extremely valuable, this gives us a more high-resolution understanding of the urban microclimate on our campus,” notes Sanjana Paul, past technical associate with Senseable City and current graduate student in the Department of Urban Studies and Planning who helps oversee data collection and analysis.
After collection, temperature data are analyzed and mapped. The data will soon be published in the updated Climate Resiliency Dashboard and will help inform actions through the Climate Resiliency and Adaptation Roadmap, but in the meantime, the information has already provided some important insights. “There were some parts of campus that were much hotter than I expected,” explains Paul. “Some of the temperature readings across campus were regularly going over 100 degrees during heat waves. It’s a bit surprising to see three digits on a temperature reading in Cambridge.” Some strategies are also already being put into action, including planting more trees to support the urban campus forest and launching cooling locations around campus to open during days of extreme heat.
As data gathering enters its fourth summer, partners continue to expand. Senseable City first began capturing data in 2021 using sensors placed on MIT Recycling trucks, and the Urban Risk Lab has offered community-centered temperature data collection with the help of its director and associate professor of architecture, Miho Mazereeuw. More recently, students in course 6.900 (Engineering for Impact) worked to design heat sensors to aid in the data collection and grow the fleet of sensors on campus. Co-instructed by EECS senior lecturer Joe Steinmeyer and EECS professor Joel Voldman, students in the course were tasked with developing technology to solve challenges close at hand. “One of the goals of the class is to tackle real-world problems so students emerge with confidence as an engineer,” explains Voldman. “Having them work on a challenge that is outside their comfort zone and impacts them really helps to engage and inspire them.”
Centering on people
While the temperature data offer one piece of the resiliency planning puzzle, knowing how these temperatures will affect community members is another. “When we look at impacts to our campus from heat, people are the focus,” explains Goldberg. “While stress on campus infrastructure is one factor we are evaluating, our primary focus is the vulnerability of people to extreme heat.” Impacts to community members can range from disrupted nights of sleep to heat-related illnesses.
As the team looked at the data and spoke with individuals across campus, it became clear that some community members might be more vulnerable than others to the impact of extreme heat days, including ground, janitorial, and maintenance crews who work outside; kitchen staff who work close to hot equipment; and student athletes exerting themselves on hot days. “We know that people on our campus are already experiencing these extreme heat days differently,” explains Susy Jones, senior sustainability project manager in the Office of Sustainability who focuses on environmental and climate justice. “We need to design strategies and augment existing interventions with equity in mind, ensuring everyone on campus can fulfill their role at MIT.”
To support those strategy decisions, the resiliency team is seeking additional input from the MIT community. One hoped-for outcome of the roadmap and dashboard is for community members to review them and offer their own insight and experiences of heat conditions on campus. “These plans need to work at the campus level and the individual,” says Goldberg. “The data tells an important story, but individuals help us complete the picture.”
A model for others
As the dashboard update nears completion and the broader resiliency and adaptation roadmap of strategies launches, their purpose is twofold: help MIT develop and inform plans and procedures for mitigating and addressing heat on campus, and serve as a model for other universities and communities grappling with the same challenges. “This approach is the center of how we operate at MIT,” explains Director of Sustainability Julie Newman. “We seek to identify solutions for our own campus in a manner that others can learn from and potentially adapt for their own resiliency and climate planning purposes. We’re also looking to align with efforts at the city and state level.” By publishing the roadmap broadly, universities and municipalities can apply lessons and processes to their own spaces.
When the updated Climate Resiliency Dashboard and Climate Resiliency and Adaptation Roadmap go live, it will mark the beginning of the next phase of work, rather than an end. “The dashboard is designed to present these impacts in a way everyone can understand so people across campus can respond and help us understand what is needed for them to continue to fulfill their role at MIT,” says Goldberg. Uncertainty plays a big role in resiliency planning, and the dashboard will reflect that. “This work is not something you ever say is done,” says Goldberg. “As information and data evolves, so does our work.”