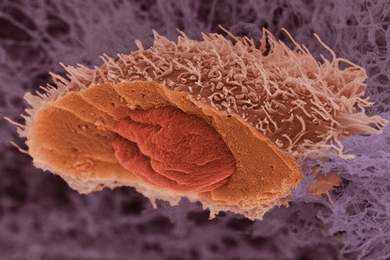
Some cancer mutations slow tumor growth
Surprising result suggests that enhancing these mutations’ impact could offer a new way to treat cancer.
Surprising result suggests that enhancing these mutations’ impact could offer a new way to treat cancer.
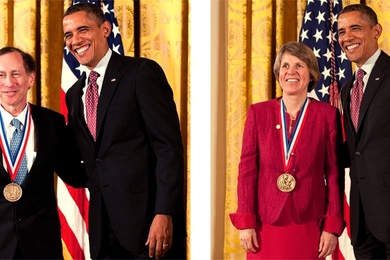
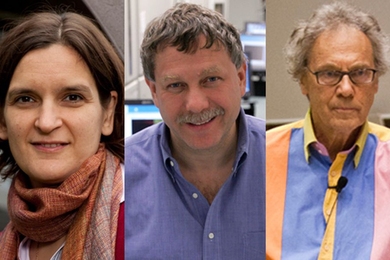
President Obama presented the two MIT professors with the National Medal of Science and National Medal of Technology and Innovation on Friday.
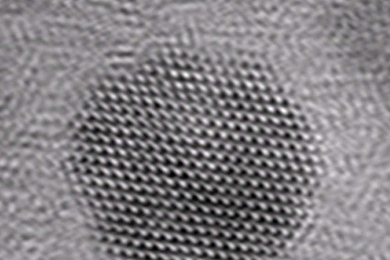
New production method could enable everything from more efficient computer displays to enhanced biomedical testing.
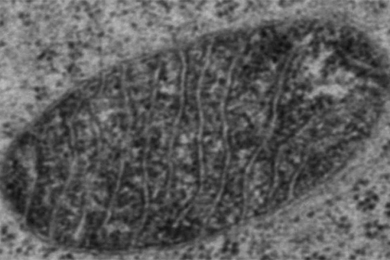
New technique pinpoints protein locations, helping scientists figure out their functions.
EdX takes stock of last semester’s MITx courses; data will be used to improve education online and in the classroom.
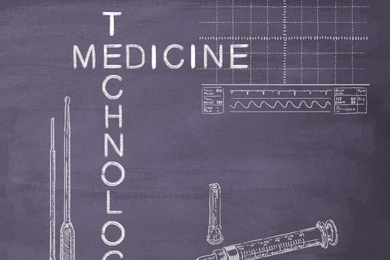
Precision machine design class links doctors with students to find ways of meeting pressing medical needs for new technology.
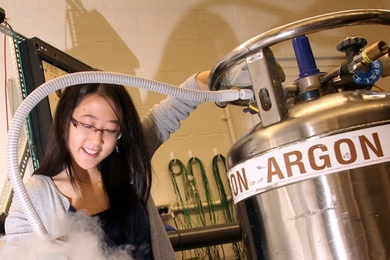
MIT senior Christie Chiu has found her focus: the study of tiny particles.

At the intersection of medicine and computer science, researchers look for clinically useful correlations amid mountains of information.
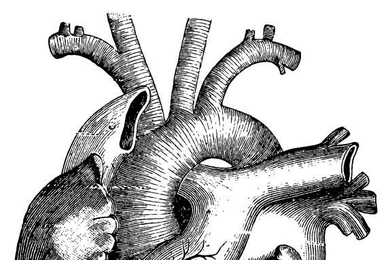
Biologists find that long non-coding RNA molecules are necessary to regulate differentiation of embryonic stem cells into cardiac cells.
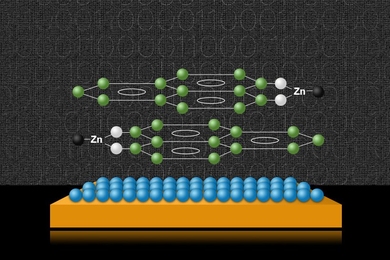
An international team of researchers demonstrates the possibility of molecular memory near room temperature.
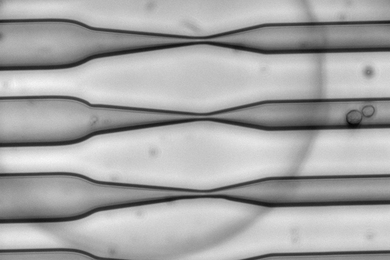
By deforming cells, researchers can deliver RNA, proteins and nanoparticles for many applications.
Program aims to help students gain perspective on new methodologies, improve overall research skills.
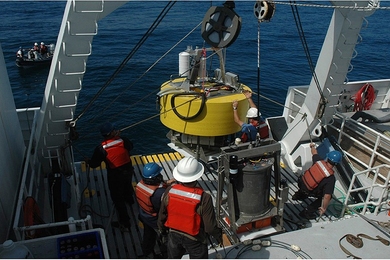
Scientists track ocean microbe populations in their natural habitat to create a ‘day in the life’ montage.

Mutant forms of the gene disrupt chemical modifications that control access to genes necessary for normal brain cell function.