
Study finds the hidden — and uneven — price of piecemeal energy policies
MIT researchers find the national and regional impacts of U.S. regulatory policies for mitigating climate change.

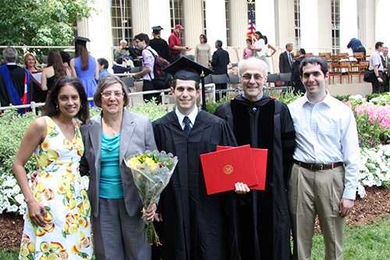
MIT graduates urged: “Solve the unsolvable!”
“Many of tomorrow’s problems are going to be solved by you,” DuPont CEO Ellen Kullman tells 2014 grads.

President L. Rafael Reif's charge to the graduates
"Rebuild the engine of society until it delivers the kind of performance we expect from ourselves at MIT," president tells the Class of 2014.
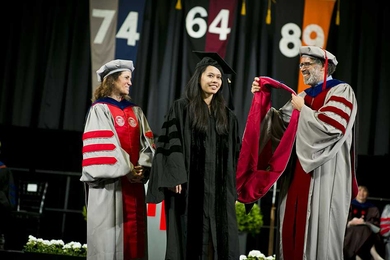
Slideshow: 2014 doctoral hooding ceremony
Advanced degree candidates receive their doctoral hoods in advance of Commencement.

A new approach to diversity research
MIT professor suggests a rethinking of homogeneity as the baseline used to study diversity.

MIT LGO alumni and colleagues give big thanks to Rosenfield
Founding director of Leaders for Global Operations program retires after 26 years
School of Engineering awards for 2014
Awards given to outstanding faculty, and graduate and undergraduate students

The incredible shrinking “power brick”
Startup FINsix leverages novel MIT technology to shrink laptop adapters to a quarter the size.
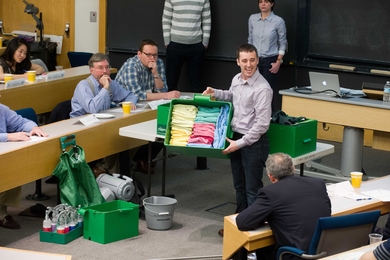
Product Design and Development class partners with MIT Sloan and RISD
Course 2.739 brings engineering, business, and design students together to learn about developing new products
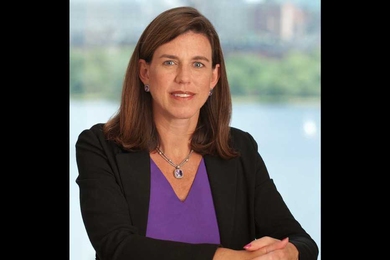
MIT Sloan professor Kristin Forbes named to UK Monetary Policy Committee
Economics professor will serve three-year term helping to guide policy.
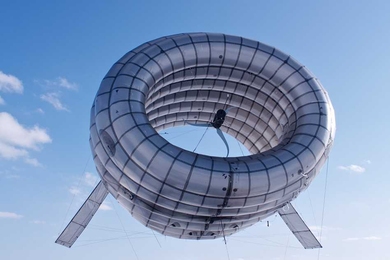
High-flying turbine produces more power
MIT alumni develop airborne wind turbine that floats 1,000 feet aloft to capture stronger, steadier winds.

Grid reliability and the role of natural gas
MIT Energy Initiative analysis suggests approaches to make the electricity system more resilient by improving its interdependency with natural gas.
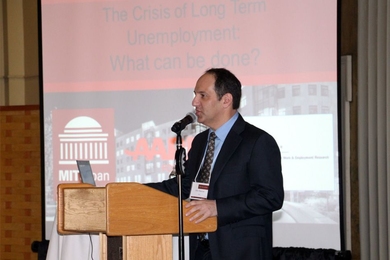
Search without reward
MIT conference highlights the plight of the long-term unemployed, a social issue of growing urgency.

Female scholars led by MIT anthropologist Susan Silbey illuminate path to commonsense regulation
Journal volume advances research stalled by political agendas