Across science and engineering, computers are often enlisted to find patterns in data. The data might be genetic information about a population, and the pattern could be which gene variants predispose people to asthma. Or the data might be frames of video, and the patterns could be objects that move or stand still from frame to frame, which data-compression or image-sharpening algorithms might want to locate.
In most cases, more data means more reliable inference of patterns. But how much data is enough? Vincent Tan, a graduate student in the Department of Electrical Engineering and Computer Science, and his colleagues in Professor Alan Willsky's Stochastic Systems Group have taken the first steps toward answering that question.
Tan, Willsky and Animashree Anandkumar, a postdoc in Willsky's group, envision data sets as what mathematicians call graphs. A graph is anything with nodes and edges: Nodes are generally depicted as circles and edges as lines connecting them. A typical diagram of a communications network, where the nodes represent electronic devices and the edges represent communications links, is a graph.
In the MIT researchers' work, however, the nodes represent data and the edges correlations between them. For instance, one node might represent asthma, and the others could be a host of environmental, physiological and genetic factors. Some of the factors might be correlated with asthma, others not; other factors might be correlated with each other but not with asthma. Moreover, the edges can have different weights: The strength of the correlations can vary. From this perspective, a computer charged with pattern recognition is given a bunch of nodes and asked to infer the weights of the edges between them.
Stars and Chains
The MIT researchers are concentrating on graphs known as trees. Technically, a tree is a graph without any closed circuits: for any node, there's no sequence of edges that will lead you back to it without backtracking. But intuitively, a tree is a graph that looks like a family tree, with a single node at the top connected to one or more nodes in the layer below, which are connected to nodes in the layer below them, and so on. The patterns formed by data of interest won't always be trees, but when they aren't, there's generally a tree that closely approximates them. And trees are much easier to work with mathematically than graphs with random shapes.
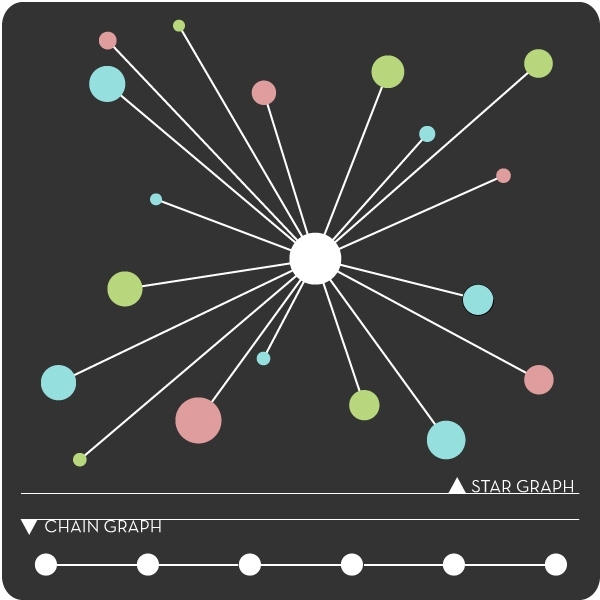
In an article published this spring in IEEE Transactions on Signal Processing, the researchers demonstrated that trees with a "star" pattern — in which one central node is connected to all the others — are the hardest to recognize; their shape can't be inferred without lots of data. Suppose, for instance, that the central node represents asthma, and 100 other nodes represent all the factors that can contribute to it. If the computer system looks at 100 data samples, each one could imply a different predictor of asthma. It might require tens of thousands of samples before the system could reliably conclude which factors have stronger correlations than others.
Trees that form "chains," on the other hand — where each node is linked to at most two others — are the easiest to recognize. Suppose that a computer system was analyzing concentrations of chemicals in biological cells. If the data reflected different stages of a single, complicated biochemical process, then the chemicals present at each stage might determine the chemicals present at the next. In that case, it would be fairly easy to conclude, with few data samples, the correlations between successive stages of the process.
The results for stars and chains led the researchers to hope that the difficulty of recognizing a tree pattern is purely a function of its diameter — the distance between the two farthest-apart nodes. (In a star, the diameter is two: No two nodes are more than two hops apart. In a chain, the diameter is equal to the number of nodes.) Unfortunately, that turns out not to be the case. For trees with shapes other than stars or chains, "Strength of the connectivity between the variables matters," Tan says. "We cannot discount it." Nonetheless, the tools that the researchers used to evaluate the best- and worst-case scenarios could shed further light on the intermediary cases.
"When you have large and high-dimensional data sets, it becomes very difficult to compute with more-general models," says John Lafferty, a professor of computer science at Carnegie-Mellon University. "So having this tree-structured approximation is much more computationally efficient." Lafferty points out, however, that the MIT researchers' work assumes that the data being analyzed have a "normal distribution" — that a graph of them would have the familiar bell-curve shape. "You'd like the distribution to have any shape," says Lafferty, an extension of the MIT researchers' result that his own group has been working on. Lafferty also says that pattern-recognition techniques that "relax this tree assumption" — that can tolerate a few closed loops in the graph — would be more generally useful. But that's something that Willsky's group is already working to do, he says.
