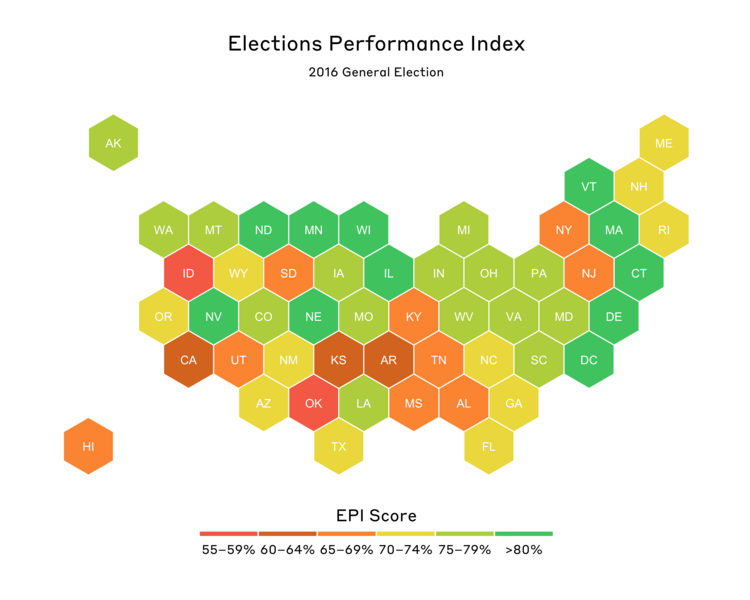
The administration of elections by states improved overall by six percentage points between 2012 and 2016, according to the new Elections Performance Index (EPI) released by the MIT Election Data and Science Lab (MEDSL).
Using indicators ranging from wait times at the polls and voter turnout to problems with absentee ballots, voter registration, or voting technology, the EPI provides a nonpartisan, objective measure of how well each state is faring in managing national elections. The index, which was developed and managed by The Pew Charitable Trusts before being transferred to MEDSL in 2017, can show the impact of policy changes and where a state might be doing well or facing challenges. Voters, policymakers, and election officials can use its rankings to compare their state with its own past performance, as well as the performance of other states.
“The index is an important foundation for the ongoing discussions on election management,” says Charles Stewart III, the Kenan Sahin Distinguished Professor of Political Science at MIT and MEDSL’s founding director. “The new release of the index helps remind us that election administration is a multidimensional challenge. Significant improvements in the 2016 index also illustrate that when election officials commit themselves to a path of improvement, good things can happen.”
Overall, almost all states improved their index scores in the 2016 election, compared with the 2012 presidential election. Twenty-two states improved at a rate greater than the national average. Overall, Vermont showed the most significant improvement, landing at the top of the index for the first time after expanding the availability of online voter tools, providing online voter registration, and requiring a postelection audit. The District of Columbia, West Virginia, and South Carolina also saw significant gains in their scores and rankings.
Only six states saw their scores decline from 2012. This is largely due to an increase in the residual vote rate, which is a common measure of voting machine performance. However, the residual vote rate can also increase when more voters abstain from voting for president, which appears to have been a significant factor in the decline of four of the six states.
When it launched in 2013, the EPI provided the first comprehensive assessment of election administration in all 50 states and Washington, D.C. Its 17 indicators (which were winnowed down by an advisory committee from an initial list of 40) were selected as measurements for reliable, consistent, and valid data that covered the broad scope of issues involved in managing an election.
“We felt it was important to reflect a wide variety of factors that could determine whether voting was convenient and secure,” says Stewart, who was one of the convenors of the EPI advisory committee. “We selected not only obvious measures like voter turnout, but also less visible factors that nonetheless affect a lot of voters, such as the handling of absentee ballots and residual votes.”
The EPI now includes data from every federal U.S. election since 2008. The online index provides an interactive way to see how election administration has changed over time during this period, and allows users to explore the context behind each measurement, as well as the data. Individual pages show the story for each state, explain what each indicator means, and illustrate differences or trends.
Cybersecurity has been a hot topic in discussions on U.S. election administration; some voters and election officials might understandably wonder whether the EPI sheds light on the issue.
The short answer: “It’s complicated,” says Stewart.
“The EPI tries to measure policy outputs whenever possible, and it’s very difficult to measure the security of a state’s election system directly,” he says. “Certainly, if a major attack on a state’s computer system dramatically affected the ability to vote, it would show up in a number of factors we measure.”
For example, if such an attack occurred, voter turnout might be lower, more provisional ballots might be used, more voters might complain of registration problems, or longer lines might form at the polls. The EPI already measures those factors, as well as whether states require audits of election results, which, says Stewart, “is one way to capture whether the voting machines or tallying systems were tampered with.
“Still, we’d like to develop a measure closer to cybersecurity itself, and we plan to work on that for the next release,” he says.
One interesting thread to trace in the EPI is the issue of long lines at the polls, which made headlines in 2012. This spurred then-President Obama to appoint a commission to study a wide variety of election administration issues, including voting wait times.
The effort that state and local officials put into addressing wait times at polling places paid off, as the significant drop in this indicator for many of 2012’s worst-performing states shows. Florida — which at 45 minutes had the longest average wait to vote in 2012 — dropped to a 2016 wait-time of 5.5 minutes. The District of Columbia, which had 2012’s second-longest average wait, saw wait times drop from 33.9 minutes to 16.3 minutes in 2016. Overall, seven states had average wait times of more than 20 minutes in 2012, but by 2016 that number dropped to zero.
(MIT, along with the Bipartisan Policy Center, has had a major program to work with election officials to record line lengths and reduce wait times. A report on this effort, entitled “Improving the Voter Experience," was released in April.)
There are a few other trends that stand out to seasoned election watchers.
“One of the most surprising things we saw in 2016 was a spike in the residual vote rate,” says Stewart. This indicator measures the performance of voting machines; to do so, it calculates the number of under-votes and over-votes cast in an election, as a percentage of voter turnout. An under-vote occurs when no vote is recorded on a ballot; an over-vote, conversely, means a ballot has votes for more than one candidate in a single-winner race.
Because it’s calculated using the top office on the ballot, the residual vote rate is only calculated every four years, using the presidential vote (the top office for midterm elections varies considerably from state to state). The 2000 election, with its infamous punch cards and hanging chads, still holds the record for highest residual vote rate in the last two decades. Nationwide, the rate in that election was 1.9 percent, with state highs of up to 3.9 percent. In contrast, the average rate for the 2012 election was only 0.99 percent.
The nationwide residual vote rate in 2016, however, spiked up to 1.39 percent. Why such a significant jump? It may be due to an increase in voters abstaining from casting a vote in the contentious presidential race, rather than a decline in the performance of voting machines. Interestingly, Nevada saw a historical low in the residual vote rate in 2016. The state offers an option on its ballots for voters to choose “none of these candidates.”
As MEDSL’s staff look ahead to the next federal election, now less than three months away, they’re already planning out their approach for the 2018 EPI.
“We learned in 2016 that the EPI indicators are remarkably stable within states over time, although changes in election policies can dramatically change a state’s position in the index,” says Cameron Wimpy, the lab’s research director. “Looking ahead to 2018, we’ll be thinking about other objective measures of election administration that vary across the states.”
Nearly 10 years after the first EPI advisory committee was convened, MEDSL will reconvene many of them again — plus a few new faces — to revisit the current indicators and discuss whether any might need to be altered or retired. At the same time, they’ll face the challenge of evaluating new potential measurements and data sources, and identifying whether they have a place in a redesigned index.
The bottom line?
“The core of election administration is making sure that every voter who wants to cast a vote can, and ensuring that only legal votes are cast and counted,” says Stewart. “The EPI exists to illustrate how many factors are involved in doing that, and to help the public understand what needs to be fixed. Monitoring all these factors will be our task as the U.S. rolls into another national election.”