With the recent launch of MIT’s Institute for Medical Engineering and Science, MIT News examines research with the potential to reshape medicine and health care through new scientific knowledge, novel treatments and products, better management of medical data, and improvements in health-care delivery.
Medical radiography is basically a species of photography. Historically, the patient’s limb would be positioned between an x-ray source and a photographic plate. The plate would be exposed and developed, and the result was an image of the limb’s interior.
Today, most larger x-ray machines use digital sensors rather than photographic film, but otherwise, little has changed. The raw data captured by the sensors is easily interpretable as a visual image.
That’s not true of more recent imaging technologies, however. In magnetic resonance imaging (MRI), for instance, different types of electromagnetic signals are individually analyzed and then stitched into a composite image. The algorithms that produce MRI scans are just as remarkable as the hardware.
Interpretation of the data produced by medical sensors remains one of the most fruitful applications of computer-science and signal-processing techniques in medicine, and it’s one that MIT researchers are pursuing down a number of different avenues.
Novel acquisitions
Elfar Adalsteinsson, an associate professor of electrical engineering, directs the Magnetic Resonance Imaging Group at MIT’s Research Laboratory of Electronics (RLE). One of the group’s main research topics is the use of MRI technology to do spectroscopy — the identification of chemical compounds from their spectrographic signatures — rather than imaging. This requires the development of a whole new battery of analytic techniques, but it could help medical researchers determine how the brain’s chemistry changes during the progress of different neurological diseases, with ramifications for both diagnosis and treatment.
In 2011, in joint work with Vivek Goyal’s Signal Transformation and Information Representation Group at RLE, Adalsteinsson and then-student Berkin Bilgic presented a new algorithm that could cut the time it takes to perform an MRI scan by two-thirds. Ordinarily, an MRI scan consists of several different types of measurements, each intended to capture information about a particular type of tissue. Once all the measurements are in, software arbitrates among their sometimes-conflicting implications to construct a set of three-dimensional images.
The MIT algorithm instead uses the information from the first measurement to draw some rough conclusions about anatomical structure, then uses the subsequent measurements to fill in the details. The trick is to determine how much of the initial measurement can be used to guide future inferences, and how much of it is subject to later revision.
Digital diagnosis
Polina Golland, an associate professor of computer science and electrical engineering, works with MRI data, too. But she develops algorithms for interpreting MRI images, not producing them. Golland has long been interested in a cluster of questions regarding the applicability of machine-learning techniques to the evaluation of MRI scans: Can computers automatically infer correlations between changes in brain anatomy and disease progression? Given that brain anatomy can differ significantly even among healthy people, can machine-learning algorithms learn to identify particular organs? If so, can they learn to identify those organs even when they’re grossly distorted by disease?
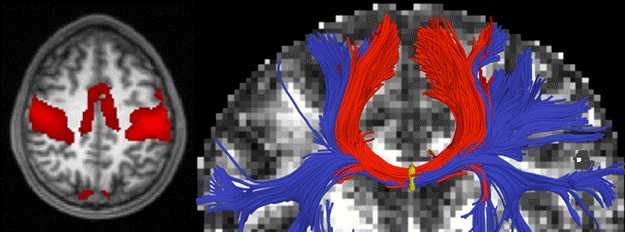
More recently, Golland has also begun to investigate the functional characterization of the brain, using two variants of conventional MRI: functional MRI (or fMRI), which can identify regions where blood flow increases during particular cognitive tasks, and diffusion MRI, which can identify the white matter that carries information between regions. In recent work, she and her grad student Archana Venkataraman showed how computer modeling can help explain the progression of several neurological diseases that seem to take root in one brain region and then radiate outward to others.
Like Golland, John Guttag, the Dugald C. Jackson Professor of Computer Science and Engineering, and Collin Stultz, the W. M. Keck Career Development Associate Professor of Biomedical Engineering, have used machine learning to identify correlations between medical-sensor data and disease. But rather than MRI scans, they concentrated on electrocardiogram (EKG) readings. By setting their algorithms loose on EKG data from 4,557 heart patients enrolled in a large clinical trial in the Boston area, they were able to identify three previously unknown indicators of the likelihood of heart attack.
On the fly
Other MIT research on the automated interpretation of medical-sensor data focuses on real-time analysis. Guttag’s Data-Driven Medicine Group has an ongoing project on the automatic recognition of epileptic seizures, using data from scalp-worn electroencephalogram (EEG) sensors. One of the difficulties in automatically identifying seizures is that patterns of neurological activity during seizures can vary widely from patient to patient.
Guttag and his students thus use machine learning to calibrate their seizure-detection algorithms to individual patients. On the basis of EEG data from just two seizures in each of 24 patients, their algorithm was able to identify 96 percent of subsequent seizures, usually within about three seconds of onset. Automatic seizure detection could enable timely alerts to patients’ caregivers and, ultimately, could even trigger the automatic dispensation of medication.
Patients with mild epilepsy, however, probably won’t want to wear EEG electrodes on a regular basis. Rosalind Picard’s Affective Computing Group at the Media Laboratory, working together with physicians at several Boston-area hospitals, showed that an unobtrusive device worn on the wrist could provide reliable information about how long it takes a patient’s brain to resume the neural oscillations known as brain waves after a seizure. At least one clinical study has shown a correlation between the duration of brainwave suppression after seizures and the incidence of sudden unexplained death in epilepsy, a condition that claims thousands of lives each year in the United States alone. Picard’s group has also found evidence that data from the same sensor could be used to identify subtler seizures that have so little outward effect that they can be missed entirely by observers.
Under pressure
Picard’s group can get away with a more discreet sensor because they use one measurement — the electrical conductivity of the skin — as a proxy for another, brain waves. George Verghese, the Henry Ellis Warren Professor of Electrical and Biomedical Engineering, and Thomas Heldt, a principal research scientist at RLE, do something similar with intracranial pressure, or pressure on the brain. The proxies they rely on, however, are blood pressure and cerebral blood flow velocity, which is measured by an ultrasound wand slid across the temple.
Measuring intracranial pressure directly is an incredibly invasive procedure, requiring the drilling of a hole in the skull, so it’s done only with patients who have severe conditions. Verghese and Heldt hope that their approach will make accurate estimates of intracranial pressure practical in cases where such drastic interventions aren’t warranted.
Verghese and Heldt don’t just turn computers loose on medical data to search for correlations; they developed a simple mathematical model of the relationship between blood pressure, cerebral blood flow velocity and intracranial pressure that factors in anatomical features such as the elasticity of brain tissue and the resistance to blood flow of vessels in the brain. In 2012, they published a paper in which they tested their model against data on patients with traumatic brain injuries, with encouraging results.
That patient data, however, had been collected in the mid-1990s, and it omitted some vital information that could skew the correlations between measurements, such as whether patients were reclining or upright when the measurements were performed. So Verghese and Heldt are currently working with physicians at Beth Israel Deaconess Medical Center to collect more-complete and more-accurate data on patients with hemorrhagic stroke, which they hope will make their model’s predictions more accurate. They’re also planning to test their model against other conditions, such as hydrocephalus, where a less-invasive proxy for intracranial-pressure measurements could make a great deal of difference to the design of treatment plans.
Medical radiography is basically a species of photography. Historically, the patient’s limb would be positioned between an x-ray source and a photographic plate. The plate would be exposed and developed, and the result was an image of the limb’s interior.
Today, most larger x-ray machines use digital sensors rather than photographic film, but otherwise, little has changed. The raw data captured by the sensors is easily interpretable as a visual image.
That’s not true of more recent imaging technologies, however. In magnetic resonance imaging (MRI), for instance, different types of electromagnetic signals are individually analyzed and then stitched into a composite image. The algorithms that produce MRI scans are just as remarkable as the hardware.
Interpretation of the data produced by medical sensors remains one of the most fruitful applications of computer-science and signal-processing techniques in medicine, and it’s one that MIT researchers are pursuing down a number of different avenues.
Novel acquisitions
Elfar Adalsteinsson, an associate professor of electrical engineering, directs the Magnetic Resonance Imaging Group at MIT’s Research Laboratory of Electronics (RLE). One of the group’s main research topics is the use of MRI technology to do spectroscopy — the identification of chemical compounds from their spectrographic signatures — rather than imaging. This requires the development of a whole new battery of analytic techniques, but it could help medical researchers determine how the brain’s chemistry changes during the progress of different neurological diseases, with ramifications for both diagnosis and treatment.
In 2011, in joint work with Vivek Goyal’s Signal Transformation and Information Representation Group at RLE, Adalsteinsson and then-student Berkin Bilgic presented a new algorithm that could cut the time it takes to perform an MRI scan by two-thirds. Ordinarily, an MRI scan consists of several different types of measurements, each intended to capture information about a particular type of tissue. Once all the measurements are in, software arbitrates among their sometimes-conflicting implications to construct a set of three-dimensional images.
The MIT algorithm instead uses the information from the first measurement to draw some rough conclusions about anatomical structure, then uses the subsequent measurements to fill in the details. The trick is to determine how much of the initial measurement can be used to guide future inferences, and how much of it is subject to later revision.
Digital diagnosis
Polina Golland, an associate professor of computer science and electrical engineering, works with MRI data, too. But she develops algorithms for interpreting MRI images, not producing them. Golland has long been interested in a cluster of questions regarding the applicability of machine-learning techniques to the evaluation of MRI scans: Can computers automatically infer correlations between changes in brain anatomy and disease progression? Given that brain anatomy can differ significantly even among healthy people, can machine-learning algorithms learn to identify particular organs? If so, can they learn to identify those organs even when they’re grossly distorted by disease?
More recently, Golland has also begun to investigate the functional characterization of the brain, using two variants of conventional MRI: functional MRI (or fMRI), which can identify regions where blood flow increases during particular cognitive tasks, and diffusion MRI, which can identify the white matter that carries information between regions. In recent work, she and her grad student Archana Venkataraman showed how computer modeling can help explain the progression of several neurological diseases that seem to take root in one brain region and then radiate outward to others.
Like Golland, John Guttag, the Dugald C. Jackson Professor of Computer Science and Engineering, and Collin Stultz, the W. M. Keck Career Development Associate Professor of Biomedical Engineering, have used machine learning to identify correlations between medical-sensor data and disease. But rather than MRI scans, they concentrated on electrocardiogram (EKG) readings. By setting their algorithms loose on EKG data from 4,557 heart patients enrolled in a large clinical trial in the Boston area, they were able to identify three previously unknown indicators of the likelihood of heart attack.
On the fly
Other MIT research on the automated interpretation of medical-sensor data focuses on real-time analysis. Guttag’s Data-Driven Medicine Group has an ongoing project on the automatic recognition of epileptic seizures, using data from scalp-worn electroencephalogram (EEG) sensors. One of the difficulties in automatically identifying seizures is that patterns of neurological activity during seizures can vary widely from patient to patient.
Guttag and his students thus use machine learning to calibrate their seizure-detection algorithms to individual patients. On the basis of EEG data from just two seizures in each of 24 patients, their algorithm was able to identify 96 percent of subsequent seizures, usually within about three seconds of onset. Automatic seizure detection could enable timely alerts to patients’ caregivers and, ultimately, could even trigger the automatic dispensation of medication.
Patients with mild epilepsy, however, probably won’t want to wear EEG electrodes on a regular basis. Rosalind Picard’s Affective Computing Group at the Media Laboratory, working together with physicians at several Boston-area hospitals, showed that an unobtrusive device worn on the wrist could provide reliable information about how long it takes a patient’s brain to resume the neural oscillations known as brain waves after a seizure. At least one clinical study has shown a correlation between the duration of brainwave suppression after seizures and the incidence of sudden unexplained death in epilepsy, a condition that claims thousands of lives each year in the United States alone. Picard’s group has also found evidence that data from the same sensor could be used to identify subtler seizures that have so little outward effect that they can be missed entirely by observers.
Under pressure
Picard’s group can get away with a more discreet sensor because they use one measurement — the electrical conductivity of the skin — as a proxy for another, brain waves. George Verghese, the Henry Ellis Warren Professor of Electrical and Biomedical Engineering, and Thomas Heldt, a principal research scientist at RLE, do something similar with intracranial pressure, or pressure on the brain. The proxies they rely on, however, are blood pressure and cerebral blood flow velocity, which is measured by an ultrasound wand slid across the temple.
Measuring intracranial pressure directly is an incredibly invasive procedure, requiring the drilling of a hole in the skull, so it’s done only with patients who have severe conditions. Verghese and Heldt hope that their approach will make accurate estimates of intracranial pressure practical in cases where such drastic interventions aren’t warranted.
Verghese and Heldt don’t just turn computers loose on medical data to search for correlations; they developed a simple mathematical model of the relationship between blood pressure, cerebral blood flow velocity and intracranial pressure that factors in anatomical features such as the elasticity of brain tissue and the resistance to blood flow of vessels in the brain. In 2012, they published a paper in which they tested their model against data on patients with traumatic brain injuries, with encouraging results.
That patient data, however, had been collected in the mid-1990s, and it omitted some vital information that could skew the correlations between measurements, such as whether patients were reclining or upright when the measurements were performed. So Verghese and Heldt are currently working with physicians at Beth Israel Deaconess Medical Center to collect more-complete and more-accurate data on patients with hemorrhagic stroke, which they hope will make their model’s predictions more accurate. They’re also planning to test their model against other conditions, such as hydrocephalus, where a less-invasive proxy for intracranial-pressure measurements could make a great deal of difference to the design of treatment plans.