Curiosity, images, and scientific exploration
Professor of the practice Alan Lightman’s new book digs into the wonder of striking visual phenomena in nature.
Professor of the practice Alan Lightman’s new book digs into the wonder of striking visual phenomena in nature.

Open-source software by MIT MAD Fellow Jonathan Zong and others in the MIT Visualization Group reveals online graphics’ embedded data in the user’s preferred degree of granularity.

“Distance Unknown,” an exhibition by MIT’s Civic Data Design Lab, documents the often challenging journeys migrants undertake to gain economic opportunity and food security.

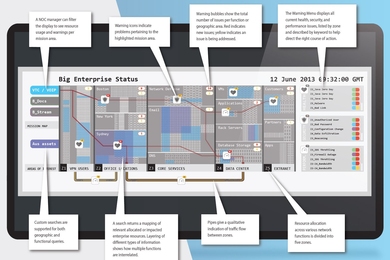
Data-visualization tool identifies sources of aberrant results and recomputes visualizations without them.

Study examines use of ‘Exhibit’ tools in creating interactive data visualizations.
New annual contest for MIT students to recognize best data analytics and visualization ideas.
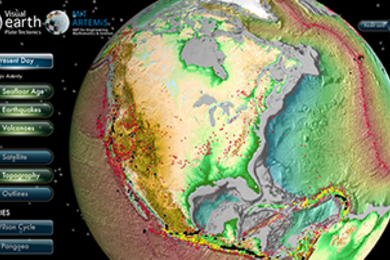
Created by OEIT's ARTEMiS group, the Plate Tectonics interactive visualization challenges students to interpret a 3-D globe of tectonic data, providing animations of the opening and closing of ocean basins and the splitting of Pangaea.
ART for Engineering, Mathematics, and Science an initiative launched last summer through MIT’s Office of Educational Innovation and Technology (OEIT).