MIT Global Founders’ Skills Accelerator announces 2013 student teams
Startup accelerator includes eight MIT student teams as well as teams from six international universities.
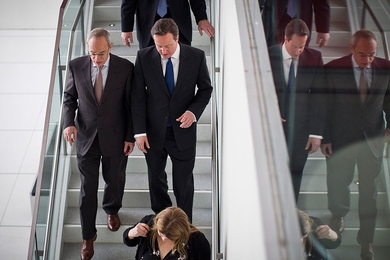
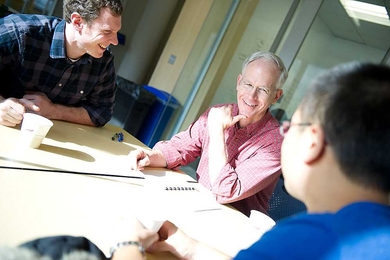
British Prime Minister David Cameron visits MIT
Personable robots, advanced prosthetics and entrepreneurship figure prominently in campus visit.
Walter Torous tapped as senior lecturer
Top scholar in real estate finance to teach at MIT Center for Real Estate, MIT Sloan School of Management
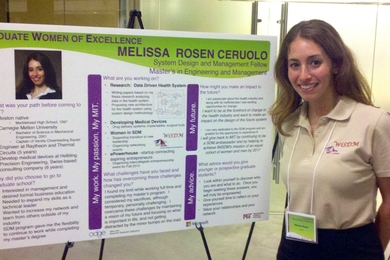
MSMS student taps MIT Sloan to power energy research
As a student in the Master of Science in Management Studies program, Vikalp Sabhlok examines ways to improve energy distribution systems in developing countries.
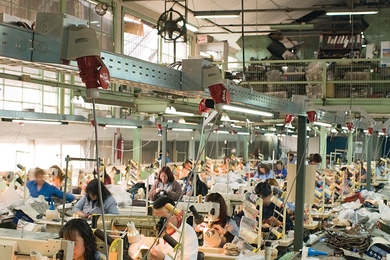
How to make factory conditions better
After years of research into global production systems, an MIT political scientist is convinced that government, not just the private sector, must help keep workers safe.
MIT Entrepreneur in Residence Network expands
Program provides resources and features advice from successful serial entrepreneurs
MIT Sloan’s new track: Enterprise Management
As part of EM Lab, students now receive academic credit while obtaining invaluable action-learning experience.
Nine MIT faculty members elected to the American Academy of Arts and Sciences
Among 198 elected this year to the prestigious honorary society.
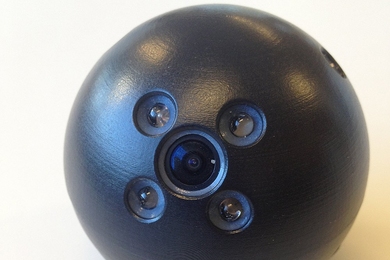
IDEAS Global Challenge team profile: Bounce Imaging
The venture has developed a low-cost, throwable device for first responders to assess dangerous situations.
Six faculty recognized for Russian engagement
Institute names inaugural Skolkovo Foundation Professors.

MIT president, senior faculty and deans ask Cambridge to approve MIT’s zoning proposal
Reif thanks City Council and the people of Cambridge for valuable input.
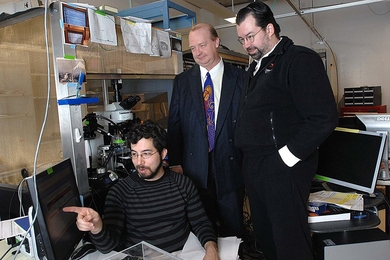
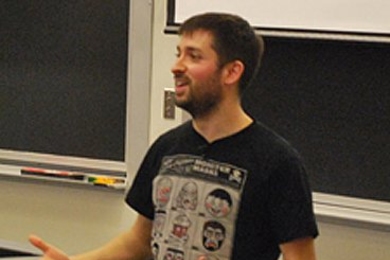
Students have engineering on the brain
MIT class offers student teams a chance to create business ventures based on neurotechnology research.