Uncertainty about the course of the Covid-19 pandemic continues, with more than 2,500,000 known cases and 126,000 deaths in the United States alone. How to contain the virus, limit its damage, and address the deep-rooted health and racial inequalities it has exposed are now urgent topics for policymakers. Earlier this spring, 300 data scientists and health care professionals from around the world joined the MIT Covid-19 Datathon to see what insights they might uncover.
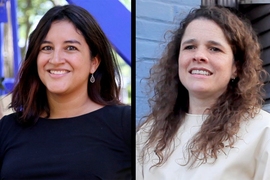
“It felt important to be a part of,” says Ashley O’Donoghue, an economist at the Center for Healthcare Delivery Science at Beth Israel Deaconess Medical Center. “We thought we could produce something that might make a difference.”
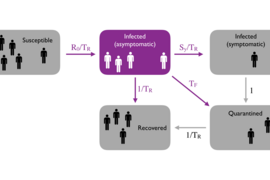
Participants were free to explore five tracks: the epidemiology of Covid-19, its policy impacts, its disparate health outcomes, the pandemic response in New York City, and the wave of misinformation Covid-19 has spawned. After splitting into teams, participants were set loose on 20 datasets, ranging from county-level Covid-19 cases compiled by The New York Times to a firehose of pandemic-related posts released by Twitter.
The participants, and the dozens of mentors who guided them, hailed from 44 countries and every continent except for Antarctica. To encourage the sharing of ideas and validation of results, the event organizers — MIT Critical Data, MIT Hacking Medicine, and the Martin Trust Center for MIT Entrepreneurship — required that all code be made available. In the end, 47 teams presented final projects, and 10 were singled out for recognition by a panel of judges. Several teams are now writing up their results for peer-reviewed publication, and at least one team has posted a paper.
“It’s really hard to find research collaborators, especially during a crisis,” says Marie-Laure Charpignon, a PhD student with MIT’s Institute for Data, Systems, and Society, who co-organized the event. “We’re hoping that the teams and mentors that found each other will continue to explore these questions.”
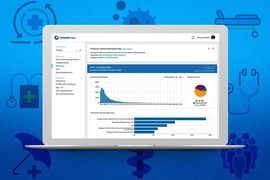
In a pre-print on medRxiv, O’Donoghue and her teammates identify the businesses most at risk for seeding new Covid-19 infections in New York, California, and New England. Analyzing location data from SafeGraph, a company that tracks commercial foot traffic, the team built a transmission-risk index for businesses that in the first five months of this year drew the most customers, for longer periods of time, and in more crowded conditions, due to their modest size.
Comparing this risk index to new weekly infections, the team classified 16.3 percent of countywide businesses as “superspreaders,” most of which were restaurants and hotels. A 1 percent increase in the density of super-spreader businesses, they found, was linked to a 5 percent jump in Covid-19 cases. The team is now extending its analysis to all 50 states, drilling down to ZIP code-level data, and building a decision-support tool to help several hospitals in their sample monitor risk as communities reopen. The tool will also let policymakers evaluate a wide range of statewide reopening policies.
“If we see a second wave of infections, we can determine which policies actually worked,” says O’Donoghue.
The datathon model for collaborative research is the brainchild of Leo Anthony Celi, a researcher at MIT and staff physician at Beth Israel Deaconess Medical Center. The events are usually coffee-fueled weekend affairs. But this one took place over a work week, and amid a global lockdown, with teammates having to meet and collaborate over Slack and Zoom.
With no coffee breaks or meals, they had fewer chances to network, says Celi. But the virtual setting allowed more people to join, especially mentors, who could participate without taking time off to travel. It also may have made teams more efficient, he says.
After analyzing communication logs from the event, he and his colleagues found evidence that the most-successful teams lacked a clear leader. Everyone seemed to chip in. “In face-to-face events, leaders and followers emerge as they project their expertise and personalities,” he says. “But on Slack, we saw less hierarchy. The most successful teams showed high levels of enthusiasm and conversational turn-taking.”
Another advantage of the virtual setting is that teams straddling several time zones could work, literally, around the clock. “You could post a message on Slack and someone would see it an hour or two later,” says Jane E. Valentine, a biomedical engineer at the Johns Hopkins University Applied Physics Laboratory. “There was a constant sense of engagement. I might be sleeping and doing nothing, but the wheels were still turning.”
Valentine collaborated with a doctor and three data scientists in Europe, the United States, and Canada to analyze anonymized medical data from 4,000 Covid-19 patients to build predictive models for how long a new patient might need to be hospitalized, and their likelihood of dying.
“It’s really useful for a clinician to know if a patient is likely to stabilize or go downhill,” she says. “You may want to monitor or treat them more aggressively.” Hospital administrators can also decide whether to open up additional wards, she adds.
Among their findings, the team found that a fever and shortness of breath were top symptoms for predicting both a long hospital stay and a high risk of death for patients, and that general respiratory symptoms were also a strong predictor of death. Valentine cautions that the results are preliminary, and based on incomplete data that the team is currently working to fill.
One of the pandemic’s cruel realities is that it has hit the poorest and most vulnerable people in society hardest. Datathon participants also examined Covid-19’s social impact, from analyzing the impact of releasing prisoners to devising tools for people to verify the flood of claims about the disease now circulating online.
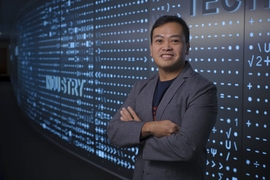
Amber Nigam, a data scientist based in New Delhi, India, has watched conspiracy theories spread and multiply on social media as contagiously as Covid-19 itself. “There’s a lot of anxiety,” he says. “Even my parents have shown me news on WhatsApp and asked if it was true.”
As the head of AI for PeopleStrong, a predictive sales startup in San Francisco, California, Nigam is comfortable with natural language processing tools and interested in their potential for fighting fake news. During the datathon, he and his team crawled the web for conspiracy theories circulating in the United States, China, and India, among other countries, and used the data to build an automated fact-checker. If the tool finds the claim to be untrue, it sends the reader to the news source where the claim was first debunked.
“A lot of people in rural settings don’t have access to accurate sources of information,” he says. “It’s super critical for people to have the right facts at their disposal.”
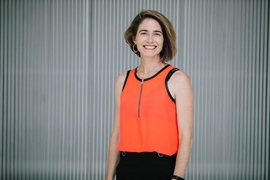
Another team looked at Covid-19’s disparate impact on people of color. Lauren Chambers, a technology fellow at the Massachusetts American Civil Liberties Union (ACLU), suggested the project and mentored the team that took it on. State by state, the team found disproportionate death rates among Black and Hispanic people, who are more likely to work “essential” service-industry jobs where they face greater exposure to people infected with the disease.
The gap was greatest in South Carolina, where Black individuals account for about half of Covid-19 deaths, but only a third of residents. The team noted that the picture nationally is probably worse, given that 10 states still do not collect race-specific data.
The team also found that poverty and lack of health care access were linked to higher death rates among Black communities, and language barriers were linked to higher death rates among Hispanic individuals. Their findings suggest that economic interventions for Black Americans, and hiring more hospital translators for Hispanic Americans, might be effective policies to reduce inequities in health outcomes.
The ACLU can’t afford to hire an army of data scientists to investigate every civil-rights violation the pandemic has brought to light, says Chambers. But collaborative events like this one give community advocates a chance to explore urgent questions they wouldn’t otherwise be able to, she says, and data scientists get to hear new perspectives, too.
“There’s a dangerous tendency among data scientists to think that numbers are the beginning and end of any good analysis,” she says. “But data are subjective, and there’s all kinds of other expertise that communities hold.”
The event was sponsored by Beth Israel Deaconess Medical Center Innovation Group, Google Cloud, Massachusetts ACLU, and the National Science Foundation’s West Big Data Innovation Hub.