Skip to content ↓

Why do some neighborhoods improve?

Density of highly educated residents, rather than income or housing costs, predicts revitalization.
Press Inquiries

Press Contact:

Abby Abazorius
Phone: 617-253-2709
MIT News Office

Media Download

By comparing 1.6 million pairs of photos taken seven years apart, researchers have now used a new computer vision system to quantify the physical improvement or deterioration of neighborhoods in five American cities, in an attempt to identify factors that predict urban change. Pictured are two street views, with the old photograph on the left and the new photograph on the right.
Download Image
Caption: By comparing 1.6 million pairs of photos taken seven years apart, researchers have now used a new computer vision system to quantify the physical improvement or deterioration of neighborhoods in five American cities, in an attempt to identify factors that predict urban change. Pictured are two street views, with the old photograph on the left and the new photograph on the right.
Credits: Courtesy of the researchers

*Terms of Use:

Images for download on the MIT News office website are made available to non-commercial entities, press and the general public under a Creative Commons Attribution Non-Commercial No Derivatives license. You may not alter the images provided, other than to crop them to size. A credit line must be used when reproducing images; if one is not provided below, credit the images to "MIT."

Close
By comparing 1.6 million pairs of photos taken seven years apart, researchers have now used a new computer vision system to quantify the physical improvement or deterioration of neighborhoods in five American cities, in an attempt to identify factors that predict urban change. Pictured are two street views, with the old photograph on the left and the new photograph on the right.
Caption:
By comparing 1.6 million pairs of photos taken seven years apart, researchers have now used a new computer vision system to quantify the physical improvement or deterioration of neighborhoods in five American cities, in an attempt to identify factors that predict urban change. Pictured are two street views, with the old photograph on the left and the new photograph on the right.
Credits:
Courtesy of the researchers

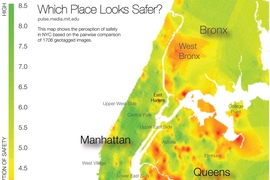
Four years ago, researchers at MIT’s Media Lab developed a computer vision system that can analyze street-level photos taken in urban neighborhoods in order to gauge how safe the neighborhoods would appear to human observers.

Now, in an attempt to identify factors that predict urban change, the MIT team and colleagues at Harvard University have used the system to quantify the physical improvement or deterioration of neighborhoods in five American cities.

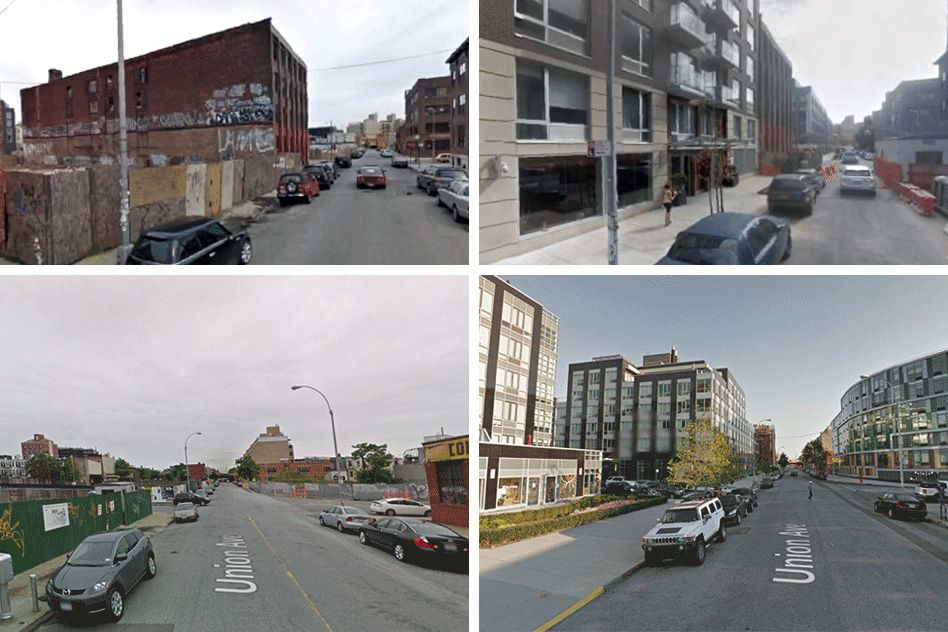
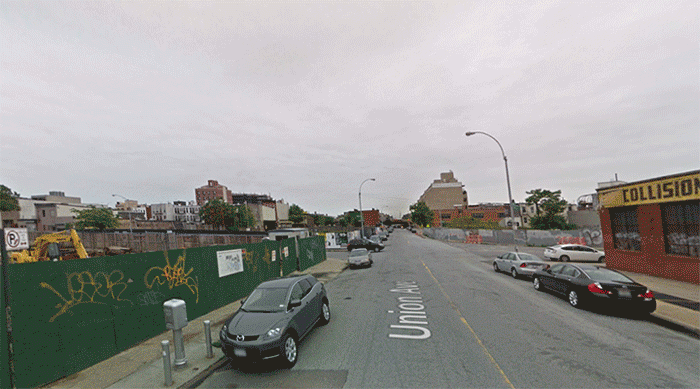
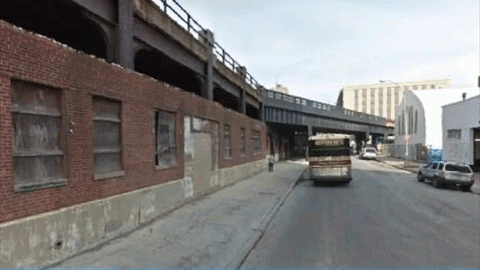
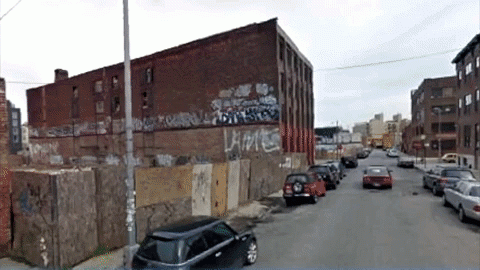
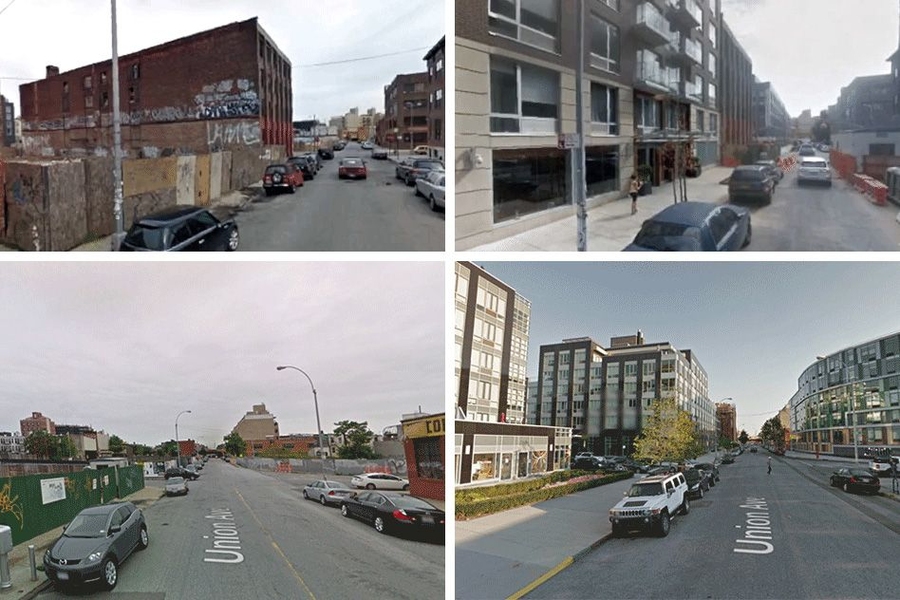
In work reported today in the Proceedings of the National Academy of Sciences, the system compared 1.6 million pairs of photos taken seven years apart. The researchers used the results of those comparisons to test several hypotheses popular in the social sciences about the causes of urban revitalization. They find that density of highly educated residents, proximity to central business districts and other physically attractive neighborhoods, and the initial safety score assigned by the system all correlate strongly with improvements in physical condition.

Perhaps more illuminating, however, are the factors that turn out not to predict change. Raw income levels do not, and neither do housing prices.

“So it’s not an income story — it’s not that there are rich people there, and they happen to be more educated,” says César Hidalgo, the Asahi Broadcasting Corporation Associate Professor of Media Arts and Sciences and senior author on the paper. “It appears to be more of a skill story.”

Tipping points

“That’s the first theory we found support for,” adds Nikhil Naik, a postdoc at MIT’s Abdul Latif Jameel Poverty Action Lab and first author on the new paper. “And the second theory was the the so-called tipping theory, which says that neighborhoods that are already doing well will continue to do better, and neighborhoods that are not doing well will not improve as much.”

While the researchers found that, on average, higher initial safety scores did indeed translate to larger score increases over time, the relationship was linear: A neighborhood with twice the initial score of another would see about twice as much improvement. This contradicts the predictions of some theorists, who have argued that past some “tipping point,” improvements in a neighborhood’s quality should begin to accelerate.

The researchers also tested the hypothesis that neighborhoods tend to be revitalized when their buildings have decayed enough to require replacement or renovation. But they found little correlation between the average age of a neighborhood’s buildings and its degree of physical improvement.

Joining Naik and Hidalgo on the paper are Ramesh Raskar, an associate professor of media arts and sciences, who, with Hidalgo, supervised Naik’s PhD thesis in the Media Lab, and two Harvard professors: Scott Kominers, an associate professor of entrepreneurial management at the Harvard Business School, and Edward Glaeser, an economics professor.

Noisy signals

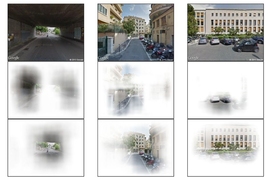
The system that assigned the safety ratings was a machine-learning system, which had been trained on hundreds of thousands of examples in which human volunteers had rated the relative safety of streetscapes depicted in pairs of images. In the new study, the system compared images associated with the same geographic coordinates from Google’s Street View visualization tool, but captured seven years apart.

Those images had to be preprocessed, however, to ensure that the system’s inferred changes in perceived safety were reliable. For instance, previous work from Hidalgo’s group suggested that prevalence of green spaces was one of the criteria that human volunteers used in assessing safety. But if the earlier of a pair of images was captured in summer, and the later was captured in winter, the machine-learning system might be fooled into thinking that the neighborhood had lost green space.

Similarly, the prevalence of buildings with street-facing windows also appeared to increase neighborhoods’ safety scores. But if a panel truck in the foreground of an image obscured three floors’ worth of windows in the building behind it, the system might assign the image an artificially low score.

So the researchers used a computer-vision technique called semantic segmentation to categorize every pixel of every one of the 1.6 million images in their data set according to the object that comprised it. If something like a truck or a pedestrian constituted too much of an image, the system rejected the image and instead compared images associated with different coordinates on the same block. Similarly, in assessing the perceived safety of a streetscape, the system ignored those parts of the image, such as trees and skies, that were too susceptible to seasonal vicissitudes.

To validate the system’s analyses, the researchers also presented 15,000 randomly selected pairs of images from their data set to reviewers recruited through Amazon’s Mechanical Turk crowdsourcing platform, who were asked to assess the relative safety of the neighborhoods depicted. The reviewers’ assessments coincided with the computer system’s 72 percent of the time. But most of the disagreements centered on pairs of images with little change in safety scores; in those borderline cases, any two humans might disagree, too.

“I think this is really interesting and visionary work by top-of-the-line researchers,” says Julia Lane, a professor at New York University’s Center for Urban Science and Progress. “I hope to see more work like this. The combination of high-quality measurement, analysis, and thoughtful attention to what is missing is the future of measurement.” 

Press Mentions

Forbes

Forbes reporter Kevin Murnane writes about how MIT researchers have used a computer vision system to examine how several American cities physically improved or deteriorated over time. Murnane writes that the study “provides important support for nuanced versions of traditional theories about why urban neighborhoods change over time.”

United Press International (UPI)

UPI reporter Amy Wallace writes that MIT researchers have applied a computer vision system to help quantify the physical improvement of American neighborhoods. The researchers found that “density of highly educated residents, proximity to central business districts and other attractive areas, and the initial safety score assigned by the computer system are strongly related to improvements.”

Related Links

Related Topics

Related Articles

More MIT News