
Chart captions that explain complex trends and patterns are important for improving a reader’s ability to comprehend and retain the data being presented. And for people with visual disabilities, the information in a caption often provides their only means of understanding the chart.
But writing effective, detailed captions is a labor-intensive process. While autocaptioning techniques can alleviate this burden, they often struggle to describe cognitive features that provide additional context.
To help people author high-quality chart captions, MIT researchers have developed a dataset to improve automatic captioning systems. Using this tool, researchers could teach a machine-learning model to vary the level of complexity and type of content included in a chart caption based on the needs of users.
The MIT researchers found that machine-learning models trained for autocaptioning with their dataset consistently generated captions that were precise, semantically rich, and described data trends and complex patterns. Quantitative and qualitative analyses revealed that their models captioned charts more effectively than other autocaptioning systems.
The team’s goal is to provide the dataset, called VisText, as a tool researchers can use as they work on the thorny problem of chart autocaptioning. These automatic systems could help provide captions for uncaptioned online charts and improve accessibility for people with visual disabilities, says co-lead author Angie Boggust, a graduate student in electrical engineering and computer science at MIT and member of the Visualization Group in the Computer Science and Artificial Intelligence Laboratory (CSAIL).
“We’ve tried to embed a lot of human values into our dataset so that when we and other researchers are building automatic chart-captioning systems, we don’t end up with models that aren’t what people want or need,” she says.
Boggust is joined on the paper by co-lead author and fellow graduate student Benny J. Tang and senior author Arvind Satyanarayan, associate professor of computer science at MIT who leads the Visualization Group in CSAIL. The research will be presented at the Annual Meeting of the Association for Computational Linguistics.
Human-centered analysis
The researchers were inspired to develop VisText from prior work in the Visualization Group that explored what makes a good chart caption. In that study, researchers found that sighted users and blind or low-vision users had different preferences for the complexity of semantic content in a caption.
The group wanted to bring that human-centered analysis into autocaptioning research. To do that, they developed VisText, a dataset of charts and associated captions that could be used to train machine-learning models to generate accurate, semantically rich, customizable captions.
Developing effective autocaptioning systems is no easy task. Existing machine-learning methods often try to caption charts the way they would an image, but people and models interpret natural images differently from how we read charts. Other techniques skip the visual content entirely and caption a chart using its underlying data table. However, such data tables are often not available after charts are published.
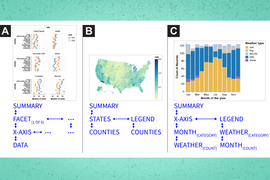
Given the shortfalls of using images and data tables, VisText also represents charts as scene graphs. Scene graphs, which can be extracted from a chart image, contain all the chart data but also include additional image context.
“A scene graph is like the best of both worlds — it contains almost all the information present in an image while being easier to extract from images than data tables. As it’s also text, we can leverage advances in modern large language models for captioning,” Tang explains.
They compiled a dataset that contains more than 12,000 charts — each represented as a data table, image, and scene graph — as well as associated captions. Each chart has two separate captions: a low-level caption that describes the chart’s construction (like its axis ranges) and a higher-level caption that describes statistics, relationships in the data, and complex trends.
The researchers generated low-level captions using an automated system and crowdsourced higher-level captions from human workers.
“Our captions were informed by two key pieces of prior research: existing guidelines on accessible descriptions of visual media and a conceptual model from our group for categorizing semantic content. This ensured that our captions featured important low-level chart elements like axes, scales, and units for readers with visual disabilities, while retaining human variability in how captions can be written,” says Tang.
Translating charts
Once they had gathered chart images and captions, the researchers used VisText to train five machine-learning models for autocaptioning. They wanted to see how each representation — image, data table, and scene graph — and combinations of the representations affected the quality of the caption.
“You can think about a chart captioning model like a model for language translation. But instead of saying, translate this German text to English, we are saying translate this ‘chart language’ to English,” Boggust says.
Their results showed that models trained with scene graphs performed as well or better than those trained using data tables. Since scene graphs are easier to extract from existing charts, the researchers argue that they might be a more useful representation.
They also trained models with low-level and high-level captions separately. This technique, known as semantic prefix tuning, enabled them to teach the model to vary the complexity of the caption’s content.
In addition, they conducted a qualitative examination of captions produced by their best-performing method and categorized six types of common errors. For instance, a directional error occurs if a model says a trend is decreasing when it is actually increasing.
This fine-grained, robust qualitative evaluation was important for understanding how the model was making its errors. For example, using quantitative methods, a directional error might incur the same penalty as a repetition error, where the model repeats the same word or phrase. But a directional error could be more misleading to a user than a repetition error. The qualitative analysis helped them understand these types of subtleties, Boggust says.
These sorts of errors also expose limitations of current models and raise ethical considerations that researchers must consider as they work to develop autocaptioning systems, she adds.
Generative machine-learning models, such as those that power ChatGPT, have been shown to hallucinate or give incorrect information that can be misleading. While there is a clear benefit to using these models for autocaptioning existing charts, it could lead to the spread of misinformation if charts are captioned incorrectly.
“Maybe this means that we don’t just caption everything in sight with AI. Instead, perhaps we provide these autocaptioning systems as authorship tools for people to edit. It is important to think about these ethical implications throughout the research process, not just at the end when we have a model to deploy,” she says.
Boggust, Tang, and their colleagues want to continue optimizing the models to reduce some common errors. They also want to expand the VisText dataset to include more charts, and more complex charts, such as those with stacked bars or multiple lines. And they would also like to gain insights into what these autocaptioning models are actually learning about chart data.
This research was supported, in part, by a Google Research Scholar Award, the National Science Foundation, the MLA@CSAIL Initiative, and the United States Air Force Research Laboratory.