Wristband enables wearers to control a robotic hand with their own movements
By moving their hands and fingers, users can direct a robot to play piano or shoot a basketball, or they can manipulate objects in a virtual environment.
By moving their hands and fingers, users can direct a robot to play piano or shoot a basketball, or they can manipulate objects in a virtual environment.
The new design could be adapted to assist the elderly, sort warehouse products, or unload heavy cargo.

Balancing automation and agency, Associate Professor Arvind Satyanarayan develops interactive data visualizations that amplify human creativity and cognition.

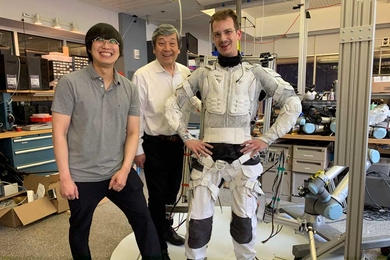
PhD student Erik Ballesteros is building “Doc Ock” arms for future astronauts.

The new design could assist the elderly as they age in place at home.
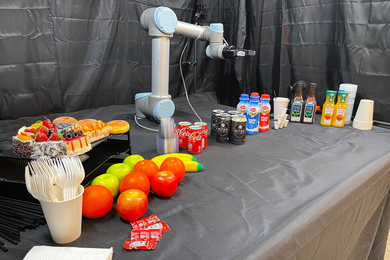
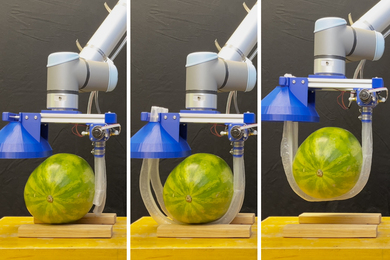
A new approach could enable intuitive robotic helpers for household, workplace, and warehouse settings.

The Tactile Vega-Lite system, developed at MIT CSAIL, streamlines the tactile chart design process; could help educators efficiently create these graphics and aid designers in making precise changes.

MIT and Sierra Leone’s Ministry of Health launch specialized program to train future clinicians on the fabrication of artificial limbs and braces for people with disabilities.

A new surgical procedure gives people more neural feedback from their residual limb. With it, seven patients walked more naturally and navigated obstacles.

The startup Augmental allows users to operate phones and other devices using their tongue, mouth, and head gestures.

A new study suggests optogenetics can drive muscle contraction with greater control and less fatigue than electrical stimulation.
A new MIT system could help astronauts conserve energy and extend missions on the lunar surface.

Fourteen Edgerton Center student-led engineering teams displayed their latest creations, from solar cars to rockets to assistive eating devices.

Screen-reader users can upload a dataset and create customized data representations that combine visualization, textual description, and sonification.
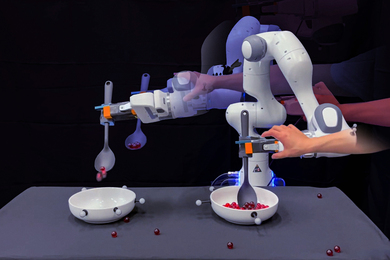
With help from a large language model, MIT engineers enabled robots to self-correct after missteps and carry on with their chores.