Oceanographers studying the physics of the global ocean have long found themselves facing a conundrum: Fluid dynamical balances can vary greatly from point to point, rendering it difficult to make global generalizations.
Factors like the wind, local topography, and meteorological exchanges make it difficult to compare one area to another. To add to the complexity, one would have to analyze billions of data points for numerous parameters — temperature, salinity, velocity, how things change with depth, whether there is a trend present — to pinpoint what physics are most dominant in a given region.
“You would have to look at an overwhelming number of different global maps and mentally match them up to figure out what matters most where,” says Maike Sonnewald, a postdoc working in the MIT Department of Earth, Atmospheric and Planetary Sciences (EAPS) and a member of the EAPS Program in Atmospheres, Oceans and Climate (PAOC). “It’s beyond what any human could decipher.”
Sonnewald, who has a background in physical oceanography and data science, uses computers to reveal connections and patterns in the ocean that would otherwise be beyond human capability. Recently, she applied a machine learning algorithm that sifted through vast amounts of data to identify patterns in the ocean that have similar physics, showing that there are five global dynamically consistent regions that make up the global ocean.
“It is amazing because it's so simple,” says Sonnewald. “It takes the really complicated world ocean and distills it down to a few important patterns. We use these to infer what's going on and to highlight areas that are more complicated.”
Sonnewald and co-authors Carl Wunsch, EAPS professor emeritus of physical oceanography and PAOC member, and Patrick Heimbach, an EAPS research affiliate and former senior research scientist, now at the University of Texas at Austin, published their findings in a special issue on “Geoscience Papers of the Future” in Earth and Space Science.
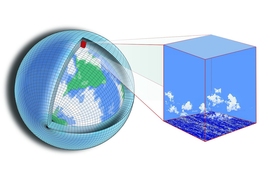
For data on what is happening in the ocean, Sonnewald used the Estimating the Circulation and Climate of the Ocean (ECCO) state estimate. ECCO is a 20-year estimate of ocean climate and circulation based on billions of points of observational data. Sonnewald then applied an algorithm that’s common in fields ranging from pharmaceutical to engineering research, called K-means clustering, which allows for identification of robust patterns in data to determine what the dominant physics in the ocean are and where they apply.
The results show that there are five clusters that compose 93.7 percent of the global ocean. For example, in the largest cluster, accounting for 43 percent of the global ocean, the most dominant physical attribute is that wind stress on the surface of the ocean is balanced by bottom torques. Areas where this is found: a thin ribbon in the Southern Ocean, large areas of the Arctic seas, zonal streaks in the tropics, and subtropical and subpolar gyres in the Northern Hemisphere.
The other four clusters similarly describe the dominant physical force and in what part of the global ocean it can be found. The algorithm also identified the remaining 6.3 percent of the ocean as areas that were too complicated to be pinned down to a simple set of physical properties. This finding is also helpful, says Sonnewald, as it allows researchers the advantage of knowing where outliers apply.
“I think that it really will ease a lot of the analysis and help us focus our research in the right places,” says Sonnewald.
Wunsch says one exciting implication of the research is that it may help oceanography look more like geology in that researchers who focus on specific regions of the ocean can collaborate and compare notes. A scientist working in one region could compare that region to one that behaves similarly.
“In a way, it’s a better way to use our tools,” says Wunsch.
What it can’t tell you, says Wunsch, is why regions behave differently. “That still takes a human being to go in and to try to understand what is going on in places where the machine identified to look,” he says.
As a next step, Sonnewald is running the same method with higher resolution data to pin down the complicated remaining 6.3 percent. The focus will be on the overturning and gyre circulation, which are both sensitive to a changing climate.
Sonnewald hopes these early findings offer compelling evidence for oceanographers to work more with data scientists to reveal more patterns present in the global ocean. Prior to coming to MIT, Sonnewald received a master’s degree in complex system simulation at The Institute for Complex Systems Simulation at the University of Southampton and a PhD in physical oceanography and complex systems simulation based at the National Oceanography Center in Southampton, England. Since then, she has focused on applying data science to physical oceanography as a postdoc at MIT and Harvard University.
Both fields have seen dramatic advancements in recent decades, says Sonnewald. But there still remains a gap between the "black-box" computing power of artificial intelligence and the deep trove of observational data that make efforts like ECCO possible.
“Because we're kind of guiding the machine learning algorithm using ocean physics and verifying the results by the canonical regimes that we know should be there, we're able to close that gap,” says Sonnewald. “It's like building a bridge between machine learning and oceanography, and hopefully other people are going to cross that bridge.”
This work was funded by the U.S. NASA Sea Level Change Team and through ECCO Consortium funding via the Jet Propulsion Laboratory.