

MIT researchers have developed a tool that makes it much easier and more efficient to explore the many compromises that come with designing new products.
Designing any product — from complex car parts down to workaday objects such as wrenches and lamp stands — is a balancing act with conflicting performance tradeoffs. Making something lightweight, for instance, may compromise its durability.
To navigate these tradeoffs, engineers use computer-aided design (CAD) programs to iteratively modify design parameters — say, height, length, and radius of a product — and simulate the results for performance objectives to meet specific needs, such as weight, balance, and durability.
But these programs require users to modify designs and simulate the results for only one performance objective at a time. As products usually must meet multiple, conflicting performance objectives, this process becomes very time-consuming.
In a paper presented at this week’s SIGGRAPH conference, researchers from the Computer Science and Artificial Intelligence Laboratory (CSAIL) describe a visualization tool for CAD that, for the first time, lets users instead interactively explore all designs that best fit multiple, often-conflicting performance tradeoffs, in real time.
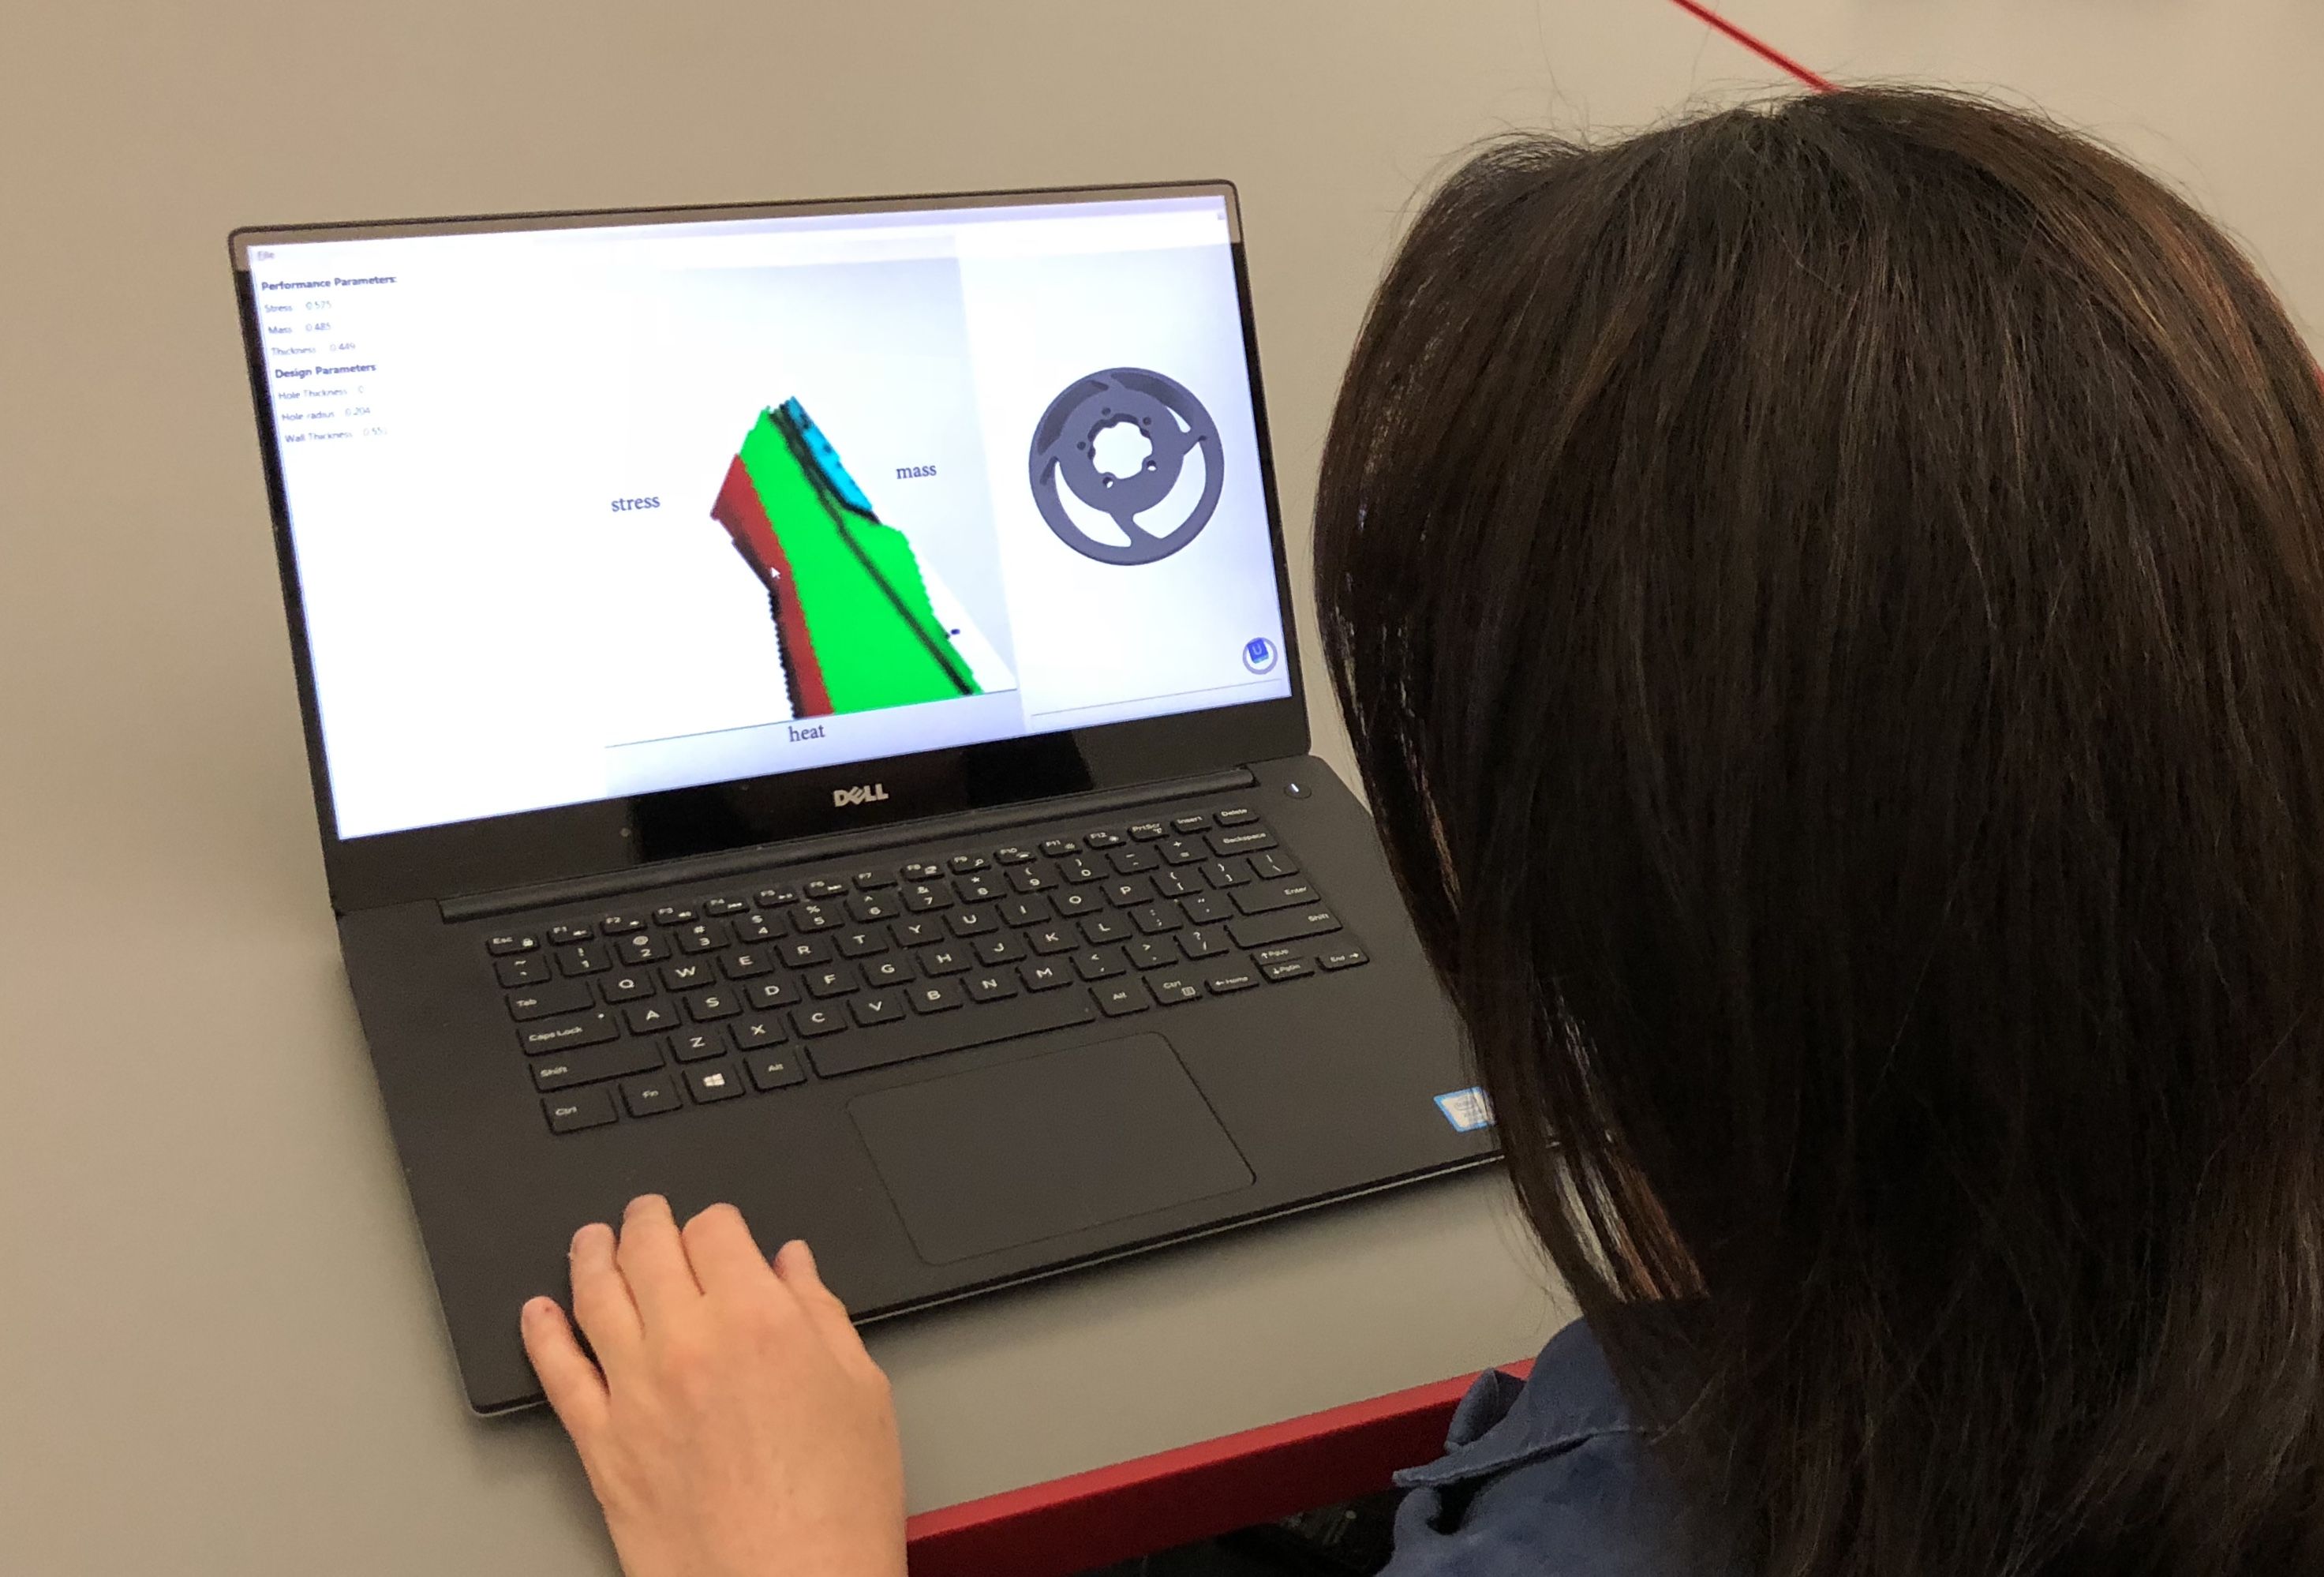
The tool first calculates optimal designs for three performance objectives in a precomputation step. It then maps all those designs as color-coded patches on a triangular graph. Users can move a cursor in and around the patches to prioritize one performance objective or another. As the cursor moves, 3-D designs appear that are optimized for that exact spot on the graph.
“Now you can explore the landscape of multiple performance compromises efficiently and interactively, which is something that didn’t exist before,” says Adriana Schulz, a CSAIL postdoc and first author on the paper.
Co-authors on the paper are Harrison Wang, a graduate student in mechanical engineering; Eitan Grinspun, an associate professor of computer science at Columbia University; Justin Solomon, an assistant professor in electrical engineering and computer science; and Wojciech Matusik, an associate professor in electrical engineering and computer science.
The new work builds off a tool, InstantCAD, developed last year by Schulz, Matusik, Grinspun, and other researchers. That tool let users interactively modify product designs and get real-time information on performance. The researchers estimated that tool could reduce the time of some steps in designing complex products to seconds or minutes, instead of hours.
However, a user still had to explore all designs to find one that satisfied all performance tradeoffs, which was time-consuming. This new tool represents “an inverse,” Schulz says: “We’re directly editing the performance space and providing real-time feedback on the designs that give you the best performance. A product may have 100 design parameters … but we really only care about how it behaves in the physical world.”
In the new paper, the researchers home in on a critical aspect of performance called the “Pareto front,” a set of designs optimized for all given performance objectives, where any design change that improves one objective worsens another objective. This front is usually represented in CAD and other software as a point cloud (dozens or hundreds of dots in a multidimensional graph), where each point is a separate design. For instance, one point may represent a wrench optimized for greater torque and less mass, while a nearby point will represent a design with slightly less torque, but more mass.
Engineers laboriously modify designs in CAD to find these Pareto-optimized designs, using a fair amount of guesswork. Then they use the front’s visual representation as a guideline to find a product that meets a specific performance, considering the various compromises.
The researchers’ tool, instead, rapidly finds the entire Pareto front and turns it into an interactive map. Inputted into the model is a product with design parameters, and information about how those parameters correspond to specific performance objectives.
The model first quickly uncovers one design on the Pareto front. Then, it uses some approximation calculations to discover tiny variations in that design. After doing that a few times, it captures all designs on the Pareto front. Those designs are mapped as colored patches on a triangular graph, where each patch represents one Pareto-optimal design, surrounded by its slight variations. Each edge of the graph is labeled with a separate performance objective based on the input data.
In their paper, the researchers tested their tool on various products, including a wrench, bike frame component, and brake hub, each with three or four design parameters, as well as a standing lamp with 21 design parameters.
With the lamp, for example, all 21 parameters relate to the thickness of the lamp’s base, height and orientation of its stand, and length and orientation of three elbowed beams attached to the top that hold the light bulbs. The system generated designs and variations corresponding to more than 50 colored patches reflecting a combination of three performance objectives: focal distance, stability, and mass. Placing the cursor on a patch closer to, say, focal distance and stability generates a design with a taller, straighter stand and longer beams oriented for balance. Moving the cursor farther from focal distance and toward mass and stability generates a design with thicker base and a shorter stand and beams, tilted at different angles.
Some designs change quite dramatically around the same region of performance tradeoffs and even within the same cluster. This is important from an engineer’s perspective, Schulz says. “You’re finding two designs that, even though they’re very different, they behave in similar ways,” she says. Engineers can use that information “to find designs that are actually better to meet specific use cases.”
“This work is an important contribution to interactive design of functional real-world objects,” says Takeo Igarashi, a professor of computer science at the University of Tokyo, and an expert in graphic design. Existing computational design tools, Igarashi says, make it difficult for designers to explore design trade-offs. “The tools work as black box and allow no or limited user control,” he says. “This work explicitly addresses this not-yet-tackled important problem. … [It] builds on a solid technical foundation, and the ideas and techniques in this paper will influence the design of design tools in the future.”
The work was supported by the Defense Advanced Research Projects Agency, the Army Research Office, the Skoltech-MIT Next Generation Program, and the National Science Foundation.