
What can we learn from where people buy their lottery tickets — and how much they spend?
“City Digits: Local Lotto,” a project from the Civic Data Design Lab at MIT and colleagues at two New York institutions, is exploring this question with the help of Brooklyn high school students who live in low-income neighborhoods where lottery spending is significant.
“Through their participation in City Digits: Local Lotto, high school students have the opportunity to use data they gathered and explored as evidence to support and voice their ideas about the lottery and its impact on their neighborhoods,” says Sarah Williams, director of the Civic Data Design Lab and assistant professor of urban planning at MIT. “In today’s data-driven society, the ability to work with and analyze data will be an essential tool for these students when pursuing a variety of careers or social justice initiatives. And from transportation planning to allocation of health care funding, the ability to work with data has become essential to engage in civic policy making.”
Data visualizations, interviews with lottery ticket buyers and sellers, and other results of the project are on view at the Cooper Hewitt museum through Feb. 26, as part of the “By the People: Designing a Better America” exhibition.
The City Digits: Local Lotto project is an ongoing collaboration with Laurie Rubel, associate professor of secondary education at CUNY’s Brooklyn College, and the Center for Urban Pedagogy, a Brooklyn-based nonprofit organization led by MIT architecture and urban planning alumna Christine Gaspar MA '04 MCP '04 that uses the power of design and art to increase meaningful civic engagement. The project has two goals: to develop and pilot innovative tools to help improve data literacy for high school students and to educate them about issues that directly affect their communities; and to examine the economic effect of the state-sponsored lottery on low-income neighborhoods in New York City.
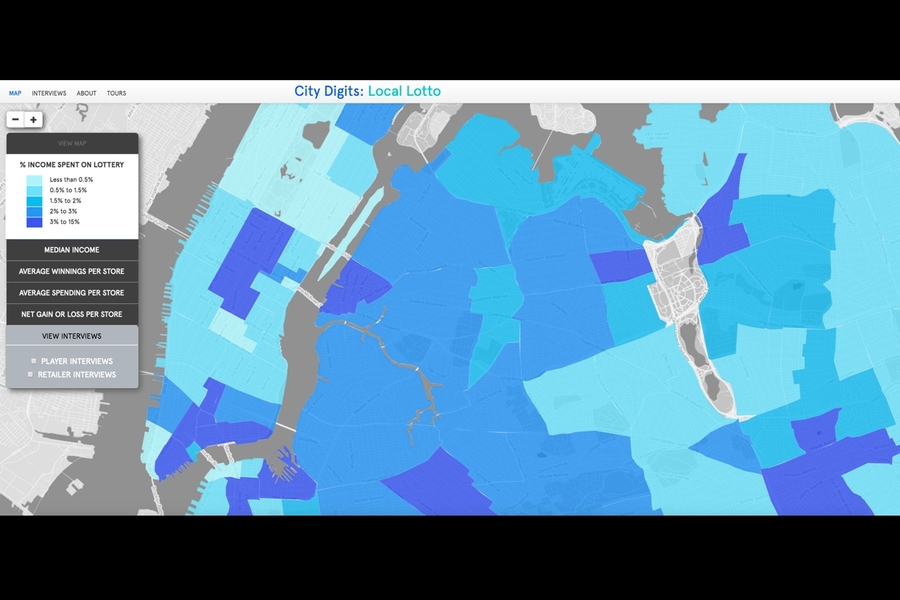
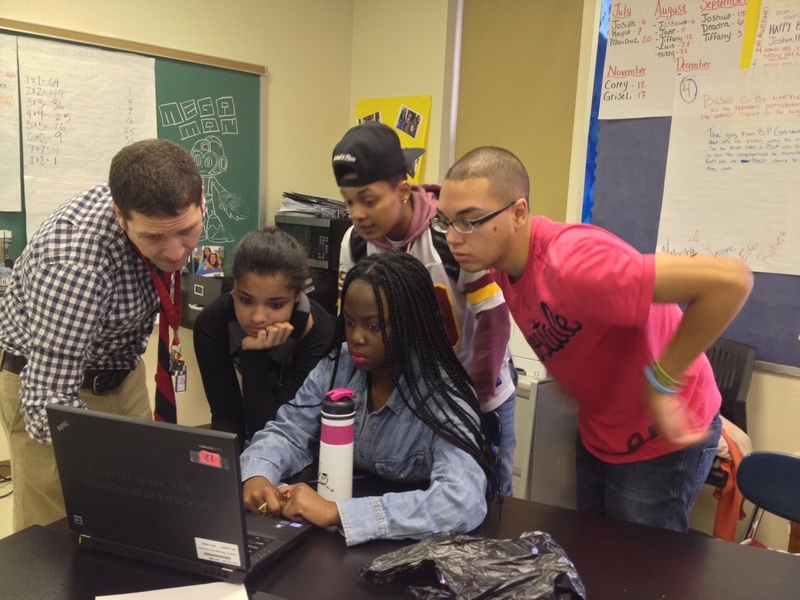
The first module from City Digits: Local Lotto was pilot tested twice in 2013 with 120 students from the Bushwick School for Social Justice. The centerpiece of the project website — and the Cooper Hewitt exhibition — is a colorful interactive map that helps users visualize geographic patterns in lottery spending.
The map allows users to toggle between income percentage spent on lottery, average winnings versus spending per store, and net gain or loss per store. Through a bold array of teal, purple, green, and pink, the map reveals that residents living under the poverty line spend a higher proportion of their income on lottery tickets than those in more affluent neighborhoods. This finding allowed students to conclude that the lottery is “a scam, because it targets low-income areas.”
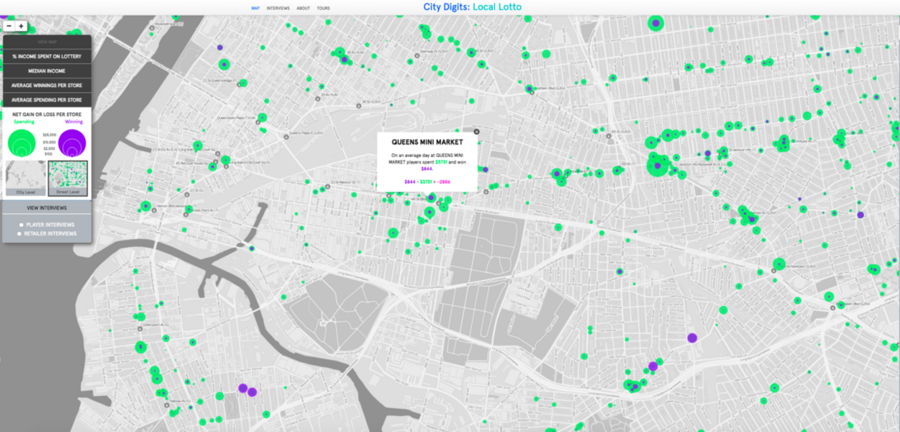
Users also have the ability to toggle between “City Level,” which organizes information by neighborhood, and “Street Level,” which reveals lottery sales and prize amounts for every store in the city. Additionally, users can zoom in until every street is visible with specific markers for each store, showing that almost all stores take in more income from lottery ticket sales than they pay out in prize money.
The project afforded students the opportunity to think critically about the lottery at a variety of spatial scales, using mathematics to support their findings. Williams found that students learn best when facing a subject that is relevant to their lives. “Integrating real-world data into the classroom brings an added level of authenticity and civic awareness,” she says, “ultimately turning otherwise disconnected mathematical investigations into rich and connected learning experiences.”
The Local Lotto curriculum uses an interactive web tool to help students learn how to calculate the probability of winning a jackpot lottery game before conducting and collecting interviews of lottery players and retailers in their neighborhood. Students then analyze citywide and local-level lottery data obtained from the New York State Lottery Commission and public data from the 2010 Census, using an interactive map.
Lastly, students synthesize qualitative interview data with quantitative map data to formulate their own opinions about the lottery’s social impact. Students create multimedia narratives called "tours" using the web tool to present what they have learned. Developing the tours allows students to synthesize their data explorations and form opinions — an important component of data literacy.
“Local Lotto accomplished many things at once,” Williams says. “It collected and organized valuable data about the local lottery while also providing high school students with the unique opportunity to improve both their data literacy and understanding of social justice issues through a hands-on curriculum.”