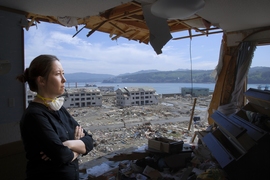
As Hurricane Irma bears down on the U.S., the MIT Urban Risk Lab has launched a free, open-source platform that will help residents and government officials track flooding in Broward County, Florida. The platform, RiskMap.us, is being piloted to enable both residents and emergency managers to obtain better information on flooding conditions in near-real time.
Residents affected by flooding can add information to the publicly available map via popular social media channels. Using Twitter, Facebook, and Telegram, users submit reports by sending a direct message to the Risk Map chatbot. The chatbot replies to users with a one-time link through which they can upload information including location, flood depth, a photo, and description.
Residents and government officials can view the map to see recent flood reports to understand changing flood conditions across the county. Tomas Holderness, a research scientist in the MIT Department of Architecture, led the design of the system. “This project shows the importance that citizen data has to play in emergencies,” he says. “By connecting residents and emergency managers via social messaging, our map helps keep people informed and improve response times.”
Home to Fort Lauderdale, Broward County is located on the southeastern coast of Florida, just north of Miami. The announcement of Risk Map has been part of the county’s preparedness communications as the area braces for the storm.
"Once the reports are generated, we’ll be able to gather information and create a publicly available map in real time [to] allow those who are in flooded areas to travel safely if they need to, and to understand what the risks are around them,” Broward County Mayor Barbara Sharief said at a news conference on Friday. “This type of information will assist us with assessing damage in real time during the storm event and help prioritize response efforts after the storm."
Researchers and government officials emphasized that Risk Map is a flood-reporting platform for the Broward County. For life-threatening situations residents should continue to call 911.
The Risk Map project is part of an ongoing collaboration between Broward County and the MIT Urban Risk Lab, which develops methods, prototypes, and technologies to embed risk reduction and preparedness into the design of cities and regions to increase the resilience of local communities. The MIT team aims to expand the map to new counties and add additional social media platforms in the near future.
“All our projects in the Urban Risk Lab try to create a conduit between government and citizens for preparing for and responding to events,” says Miho Mazereeuw, director of the Urban Risk Lab and associate professor of architecture and urbanism. “As cities become increasingly complex systems with growing populations, they bear the brunt of extreme weather events. Our platform works to increase community awareness so that we can reduce risk together.”
The Urban Risk Lab also piloted the system in Indonesia — where the project is called PetaBencana.id, or “Map Disaster” — during a large flood event on Feb. 20, 2017.
During the flooding, over 300,000 users visited the public website in 24 hours, and the map was integrated into the Uber application to help drivers avoid flood waters. The project in Indonesia is supported by a grant from USAID and is working in collaboration with the Indonesian Federal Emergency Management Agency, the Pacific Disaster Centre, and the Humanitarian Open Street Map Team.
The Urban Risk Lab team is also working in India on RiskMap.in. With support from the TATA Center for Technology and Design at MIT, the lab aims to launch the pilot this fall, in time for the monsoon season. The team is researching additional functionality for this two-way conversation with the public during such events and developing an alert system to inform residents.