An MIT analysis of how best to reduce fine particulate matter in the atmosphere has brought some surprising results. Due to past regulations, levels of key emissions that form those harmful particles are now lower than they were a decade ago, causing some experts to suggest that cutting them further might have little effect. Not true, concludes the MIT study. Using an atmospheric model, the researchers found that new policies to restrict the same emissions would be even more effective now than they were in the past. Further analysis elucidated the chemical processes — some unexpected — that explain their findings. Their results demonstrate the importance of tailoring air pollution policies to specific situations and of addressing a variety of emissions in a coordinated way.
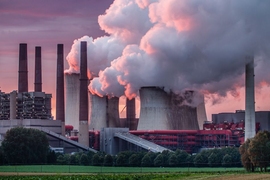
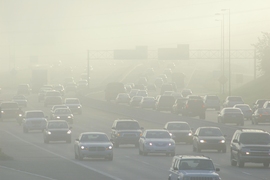
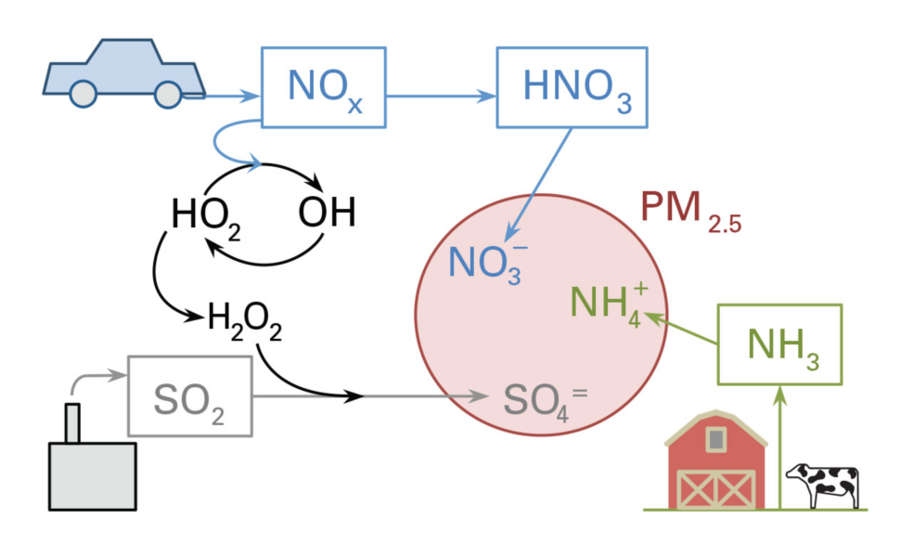
One of the most pervasive and worrisome of today’s air pollutants is particulate matter known as PM2.5. Less than 2.5 microns in diameter, these tiny particles are too small to see, but they can lodge deep within the lungs, causing health problems — including asthma and heart disease — and even premature death. Many of these particles are the result of chemical reactions within water droplets among three types of emissions: nitrogen oxides — known collectively as NOx — primarily from vehicles; sulfur dioxide (SO2) from power plants and industrial facilities; and ammonia (NH3) from agricultural activities. The mix of multiple emissions and the chemistry involved make regulating this type of pollution tricky: Reducing a given emission by 5 percent won’t necessarily reduce PM2.5 formation by 5 percent. Nevertheless, past regulations limiting NOx and SO2 emissions — along with economic trends and increased use of natural gas — have reduced PM2.5 concentrations over the past decade or so.
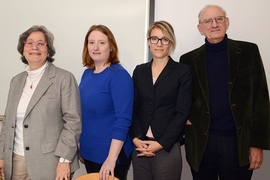
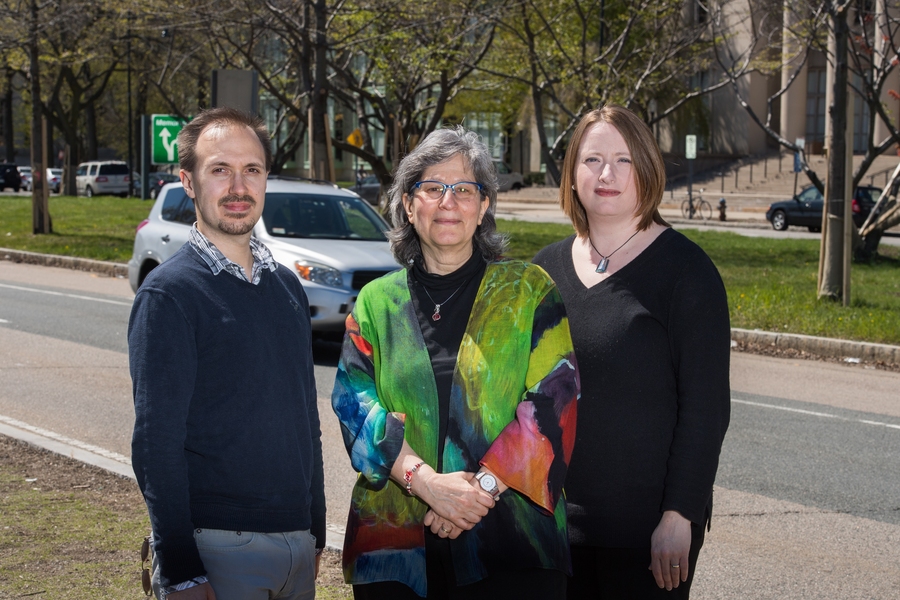
Even so, problems persist in some regions, so more policy action is needed if damage to human health is to be reduced. But how best to achieve further cuts in PM2.5 hasn’t been clear, according to Noelle Selin, the Esther and Harold E. Edgerton Career Development Associate Professor in MIT’s Institute for Data, Systems, and Society and the Department of Earth, Atmospheric and Planetary Sciences (EAPS). The reason? Background concentrations of NOx and SO2 are now far lower than they were, and that change could profoundly affect the chemistry by which emissions form PM2.5.
As a result, some experts have suggested that further cuts in NOx and SO2 could have diminishing returns. Indeed, several years ago, Selin and her EAPS colleague Susan Solomon, the Ellen Swallow Richards Professor of Atmospheric Chemistry and Climate Science, wondered whether the dramatic changes in NOx and SO2 concentrations in the last decade had changed the background chemistry such that decreasing SO2 emissions might actually now increase formation of PM2.5 because of how the emitted chemicals interact as they form particles.
Clearly, making sound regulations for particulate pollution is now more difficult than ever. “For policymaking, we’d like to know what the effectiveness of cutting one unit of a given emission would be,” says Selin. “But for every unit of NOx emitted, you might get a different amount of PM2.5 forming depending on background conditions.” Understanding the chemistry of PM2.5 formation is thus critical to designing policies that will “give us the most bang for our buck,” notes Selin.
Over the past three years, Selin, Solomon, and EAPS graduate student Jareth Holt have used complex models of chemical reactions in the atmosphere to examine that chemistry and determine how PM2.5 responds to changes in emissions levels, taking into account ambient conditions and chemistries. The analysis provides new insights into the processes by which PM2.5 forms, including unexpected changes in what controls the outcome when background conditions vary.
The MIT analysis
In their study, the MIT researchers focused on 2005 and 2012, years with markedly different background chemistries: Between 2005 and 2012, emissions of NOx dropped by 42 percent and SO2 by 62 percent, while ammonia remained about constant. They calculated “sensitivities” — how much less (or more) PM2.5 forms for a one-unit decrease (or increase) in emissions — for each of the three emissions in 2005 and 2012 all across the United States. And to capture the effects of temperature and humidity, they performed calculations for both winter and summer of each year.
They based the 2005 calculations on emissions levels from the U.S. Environmental Protection Agency (EPA) National Emissions Inventory. Geographically resolved emissions inventories weren’t yet available for 2012, but the nationwide percentage change in each of the three emissions was known. So using that percentage, the researchers adjusted the 2005 data to generate 2012 values for emissions levels across the country, thereby obtaining values for both high-emissions (2005) and low-emissions (2012) scenarios.
To simulate PM2.5 formation, the researchers used GEOS-Chem, a global chemical transport model that can track the atmospheric chemistry and three-dimensional transport of pollutants. The following example demonstrates how they calculated the sensitivities of interest. To determine the sensitivity of PM2.5 formation to NOx emissions at a given time, they needed to see how a small change in those emissions would change the amount of PM2.5 formed. So for winter of 2005, they set appropriate ambient conditions and ran two simulations, one starting with emissions 10 percent higher and the other 10 percent lower than the EPA data for that year. Comparing the results of the two simulations gave them their sensitivity value for winter of 2005, that is, the effect of a small change in emissions at that time. To test the impact of lower background concentrations of NOx, they then used the same procedure to calculate a sensitivity value based on their emissions data for winter of 2012.
Unexpected findings
The researchers performed the same analysis to find the sensitivities of each of the three pollutants — NOx, SO2, and ammonia — using their 2005 and 2012 data and assuming winter and summer ambient conditions. They found that sensitivities differ significantly in some cases — not only by year but also by season and by location within the United States. But in general, for both NOx and SO2, the findings run counter to expectations: While many experts would have expected sensitivities to be lower when background concentrations are lower, in many cases the calculated sensitivities are higher, meaning that more PM2.5 is formed for every unit of NOx and SO2 emitted into the atmosphere.
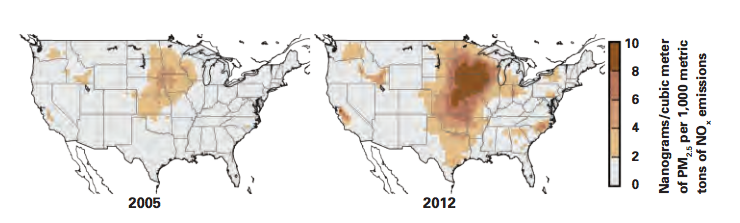
As an example, the maps in Figure 2 in the slideshow above show results for wintertime sensitivities of PM2.5 formation to NOx emissions in 2005 (left) and 2012. Each point on the map shows the change in PM2.5 at that location that results from a change in NOx emissions of 1,000 metric tons. The darker the color, the greater the response to the emissions change. A comparison of the two maps shows that the sensitivity is generally higher in 2012 than in 2005, especially in the cold, humid areas of the northern Midwest. Indeed, in those regions, the sensitivity is twice as high in 2012 as in 2005, so far more PM2.5 is formed per unit NOx emitted in 2012 than in 2005.
Sensitivities of PM2.5 formation to SO2 are likewise greater in 2012 than in 2005 — both year-round and across most of the United States. One result stands out: Sensitivity to SO2 is up to 80 percent larger in 2012 than in 2005 in the eastern United States in the summer. In contrast, sensitivities to ammonia emissions are some 40 percent lower in 2012 than in 2005, year-round and across the United States.
The results provide important guidance for policymaking: If more PM2.5 forms for each unit of NOx and of SO2 emitted now than in 2005, then the potential benefits of policies restricting those emissions have not shrunk since 2005 but rather increased in much of the country — for NOx, especially in the most polluted areas. “Because NOx levels have changed enough, you’re in a situation now where if you reduced NOx you could improve air quality significantly in the Midwest,” says Solomon.
Understanding why
Further analysis of the PM2.5 chemistry yielded explanations for those unexpected findings. How much of the airborne emissions enters an atmospheric particle depends on the availability and solubility of the three types of emitted chemicals and also on the need to maintain a neutral electrical balance within the particle. As the emissions pass through the atmosphere, they interact with light, water, and other chemical species, and — as shown in the slideshow above — they ultimately are converted to an electrically charged form: NOx becomes nitrate (NO3-), SO becomes sulfate (SO42-), and ammonia becomes ammonium (NH4+). The ammonium is the only positively charged ion; the nitrate and sulfate are both negative. Those components combine in the form of ammonium nitrate or ammonium sulfate in the particle such that there is no net charge. (The reactions are sensitive to temperature and relative humidity.)
That charge balance helps explain why the calculated wintertime sensitivity of PM2.5 formation to NOx emissions in some regions — in particular, the northern Midwest — is higher rather than lower in 2012. In 2005, there was an excess of nitrogen, so additional NOx wouldn’t yield more ammonium nitrate in particles. The NOx would become nitrate in the atmosphere, but it wouldn’t form ammonium nitrate because there wouldn’t be ammonia available to combine with it and neutralize its negative charge. Given abundant nitrogen, the availability of ammonia limits PM2.5 formation.
But when nitrogen is no longer plentiful, it becomes the limiting factor in the formation of ammonium nitrate in particles. “So when NOx emissions dropped, we went from having an excess of nitrate [in the atmosphere] to having not enough nitrate to neutralize all the available ammonia,” explains Selin. “In our model, winter conditions in the northern Midwest crossed that [chemical] threshold between 2005 and 2012. The ‘chemical regime’ changed, and suddenly every additional nitrate really matters because it will combine with ammonia to form more PM2.5. So this suggests that cutting NOx emissions now might result in even more benefit than it did in 2005.”
The fate of SO2 was also a surprise. The researchers had hypothesized that if sulfur emissions were removed but nitrogen emissions were still present, nitrate would simply replace the sulfate in the particles. Indeed, ammonium nitrate might form even more readily than ammonium sulfate does, and PM2.5 formation could increase.
But according to the analysis, that process isn’t the dominant chemical mechanism at work in 2012. The lower concentration of NOx in the atmosphere in 2012 is accompanied by a higher concentration of a key oxidizing compound that converts SO2 to sulfate. That conversion process occurs more quickly, so there’s more sulfate present in the atmosphere to combine with ammonia and produce PM2.5.
“So we found that what’s driving the change isn’t the chemistry of the particle — as we had expected — but rather the chemistry in the gases in the atmosphere,” says Selin. “And the result is that reducing the amount of SO2 in the atmosphere will reduce PM2.5 formation even more in 2012 than it did in 2005.”
Taken together, the findings of the study demonstrate the importance of understanding the processes that lead to PM2.5 formation before taking policy action. Moreover, given the major role played by interactions among the emissions, the researchers recommend considering a coordinated, multi-pollutant approach to regulation that may involve a range of emission sources, stakeholders, and government agencies.
Perhaps the most important outcome of their study, notes Solomon, is the demonstration of a new way to analyze the PM2.5 problem in any year and location. “Applying it to other places would be pretty exciting,” she says. “For example, Beijing and New Delhi have terrible pollution problems. Where are they going to get the best leverage on improving their air quality?” Answering that question is the first step in designing a cost-effective, efficient approach to reducing particulate pollution and the threat it poses to human health and well-being.
This research was supported by the MIT Energy Initiative Seed Fund Program. Follow-on research is being funded by the U.S. Environmental Protection Agency.
This article appears in the Spring 2016 issue of Energy Futures, the magazine of the MIT Energy Initiative.