U.S. Supreme Court Justice Louis Brandeis, in a 1932 opinion, wrote that a state could be a “laboratory” for policy, and “try novel social and economic experiments” on its own. We have since turned those words into today’s common political phrase that the 50 U.S. states are “laboratories of democracy.”
Some of these policy experiments move states to the right, politically, and others move states to the left. Now a new study conducted by MIT political scientists shows for the first time the modern political trajectory of all 50 U.S. states, since 1936, by examining their laws in relation to nearly 150 policy issues.
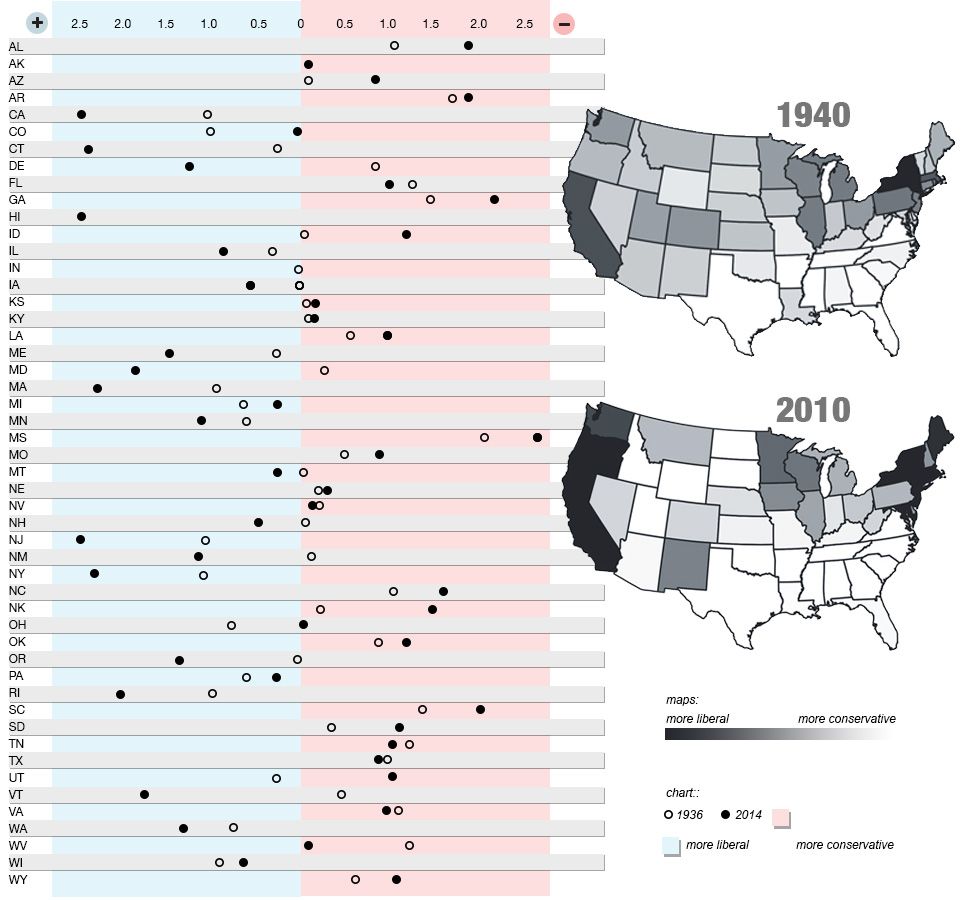
This unique research reveals at least two major trends: First, state-level policies throughout the U.S. as a whole became more liberal from the 1930s into the 1970s, an era of increasing civil rights and the development of a social safety net, but have largely remained ideologically fixed since then. There has been a small turn to the left in the last few years, due to changes in social policy such as gay marriage laws.
“States are getting a little more liberal, but it’s gradual,” says Christopher Warshaw, an assistant professor of political science at MIT, and co-author of a new paper detailing the study.
“Between 1936 and 1970, states just started doing a lot more, such as higher welfare benefits, and they taxed more,” says Devin Caughey, an assistant professor of political science at MIT and the other co-author of the study. “Then it stopped. And then economic policies have been constant, but social policies have gone in a more liberal direction.”
Second, when measured by state-level policy, the political divergence among regions of the U.S. has become much more pronounced in the last 20 years — as it also has in terms of the presidential vote, among other metrics. Whatever the underlying reasons for this much-observed divergence, state legislatures are very much part of it.
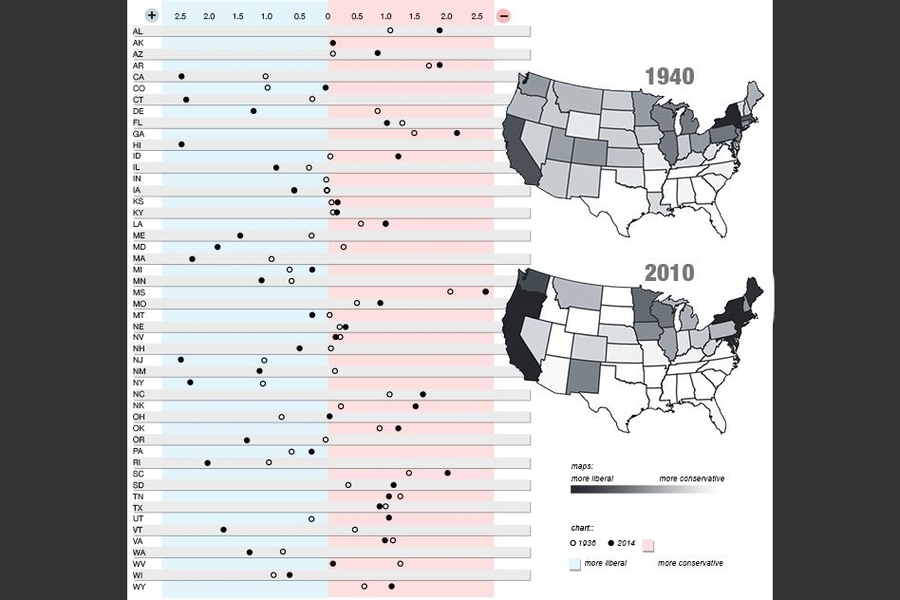
Since the 1990s, the South has become more conservative at the state-policy level, and the Midwest slightly more conservative; the Northeast and West Coast states have gotten more liberal. The Mountain West became more conservative from the mid-1970s until about 2000, from which time it has become more liberal.
Overall, since the 1930s, “There are 10 to 15 states that have shifted dramatically,” Warshaw observes: Among others, Utah and Idaho have become much more conservative, while Maryland and Vermont have become notably more liberal.
Meanwhile the states consistently at the opposite ends of the political spectrum, when it comes to their own policies, are a familiar group.
“Basically, name a policy, and Mississippi is the most conservative state,” Warshaw says. South Carolina, Georgia, Alabama, and Arkansas are the next-most conservative states. By contrast, California, Connecticut, Hawaii, Massachusetts, New York, and (perhaps surprisingly) New Jersey rank among the most liberal places in state-policy terms.
One-dimensional politics
The paper, “The Dynamics of State Policy Liberalism, 1936-2014,” is being published in the forthcoming issue of the American Journal of Political Science.
To conduct the study, Warshaw and Caughey — along with research assistants at MIT — examined 148 different state-level policy issues, evaluating each state’s position on them. To be sure, not all of those policy issues existed throughout the period studied; abortion rights, for instance, barely registered at the state level until the 1970s. Thus the political ideology that the scholars assigned to each state is derived from a set of issues — of which many, but not all, overlap at any given time.
Perhaps defying the basic intuition of some observers, Warshaw and Caughey found that state-level politics have been essentially “one-dimensional” from the 1930s onward — that is, if a state has conservative policies on economic issues, for instance, it will also have conservative policies on social issues.
This stands in contrast to the U.S. Congress, where from the 1930s through the 1960s, many Southern legislators voted for progressive-minded economic legislation such as Social Security and other New Deal laws that expanded the role of government, while maintaining a much more conservative outlook on social issues, most prominently civil rights.
“What we found was that the two-dimensional structure disappeared when we looked at states’ policies themselves,” Caughey says. “Really, the South is conservative on everything, as opposed to just being conservative on race. It has the least generous welfare policies, the most restrictive social regulations, and so on. These things we think of as being only loosely associated, when we actually look at policies, line up pretty closely.”
Questions “we had no way of tackling” before
Other scholars who have seen the paper say it is an important contribution to our understanding of state government actions over time.
“This paper fills a massive hole,” says Thad Kousser, a professor of political science at the University of California at San Diego who is an expert on state-level politics, adding: “Everyone thinks there are great questions in state politics, but not great common data sets.”
Kousser suggests that scholars will be interested in evaluating both the broad conclusions Warshaw and Caughey draw about the historical trajectory of state-level politics, and in examining narrower questions about individual states.
“This paper is going to be used widely by scholars across the country,” Kousser predicts.
The current paper is the first of multiple publications Warshaw and Caughey aim to produce based on their novel data set. They are currently working on additional papers about state-level policy changes, and would like to co-author a book on the subject that would go back to about 1900.
They also plan to make virtually all of their data publicly available in the future, to fully show their work and help other scholars pursue related research topics.
“The fun thing about this project has been the enormous number of substantive questions this opens up, that we had no way of tackling before as a discipline,” Warshaw says.
For instance: What is the connection between changes in public opinion and changes in policy? Is that relationship influenced by interest groups or other factors? How do election results and the partisan makeup of state legislatures affect policy? Are parties rewarded or punished for large shifts in policy? The data can also help scholars study the relationship between policy and economic or demographic conditions.
Warshaw adds: “Having historical measures is really important. Our hope is that this project will orient a little bit more toward thinking about how our political processes change over time, and use this historical data to test big questions.”