
Researchers from MIT’s Laboratory for Aviation and the Environment have come out with some sobering new data on air pollution’s impact on Americans’ health.
The group tracked ground-level emissions from sources such as industrial smokestacks, vehicle tailpipes, marine and rail operations, and commercial and residential heating throughout the United States, and found that such air pollution causes about 200,000 early deaths each year. Emissions from road transportation are the most significant contributor, causing 53,000 premature deaths, followed closely by power generation, with 52,000.
In a state-by-state analysis, the researchers found that California suffers the worst health impacts from air pollution, with about 21,000 early deaths annually, mostly attributed to road transportation and to commercial and residential emissions from heating and cooking.
The researchers also mapped local emissions in 5,695 U.S. cities, finding the highest emissions-related mortality rate in Baltimore, where 130 out of every 100,000 residents likely die in a given year due to long-term exposure to air pollution.
“In the past five to 10 years, the evidence linking air-pollution exposure to risk of early death has really solidified and gained scientific and political traction,” says Steven Barrett, an assistant professor of aeronautics and astronautics at MIT. “There’s a realization that air pollution is a major problem in any city, and there’s a desire to do something about it.”
Barrett and his colleagues have published their results in the journal Atmospheric Environment.
Data divided
Barrett says that a person who dies from an air pollution-related cause typically dies about a decade earlier than he or she otherwise might have. To determine the number of early deaths from air pollution, the team first obtained emissions data from the Environmental Protection Agency’s National Emissions Inventory, a catalog of emissions sources nationwide. The researchers collected data from the year 2005, the most recent data available at the time of the study.
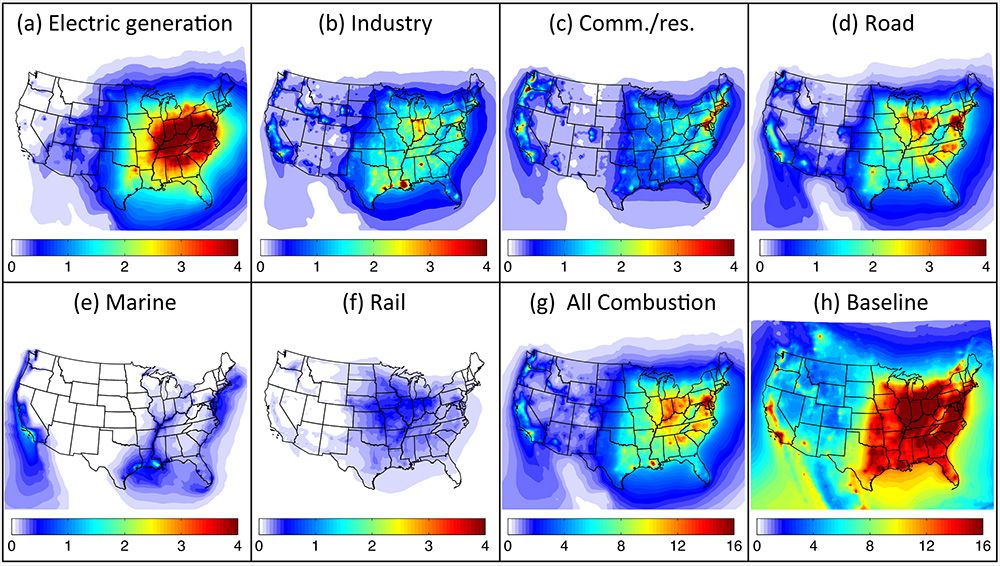
They then divided the data into six emissions sectors: electric power generation; industry; commercial and residential sources; road transportation; marine transportation; and rail transportation. Barrett’s team fed the emissions data from all six sources into an air-quality simulation of the impact of emissions on particles and gases in the atmosphere.
To see where emissions had the greatest impact, they removed each sector of interest from the simulation and observed the difference in pollutant concentrations. The team then overlaid the resulting pollutant data on population-density maps of the United States to observe which populations were most exposed to pollution from each source.
Health impacts sector by sector
The greatest number of emissions-related premature deaths came from road transportation, with 53,000 early deaths per year attributed to exhaust from the tailpipes of cars and trucks.
“It was surprising to me just how significant road transportation was,” Barrett observes, “especially when you imagine [that] coal-fired power stations are burning relatively dirty fuel.”
One explanation may be that vehicles tend to travel in populated areas, increasing large populations’ pollution exposure, whereas power plants are generally located far from most populations and their emissions are deposited at a higher altitude.
Pollution from electricity generation still accounted for 52,000 premature deaths annually. The largest impact was seen in the east-central United States and in the Midwest: Eastern power plants tend to use coal with higher sulfur content than Western plants.
Unsurprisingly, most premature deaths due to commercial and residential pollution sources, such as heating and cooking emissions, occurred in densely populated regions along the East and West coasts. Pollution from industrial activities was highest in the Midwest, roughly between Chicago and Detroit, as well as around Philadelphia, Atlanta and Los Angeles. Industrial emissions also peaked along the Gulf Coast region, possibly due to the proximity of the largest oil refineries in the United States.
Southern California saw the largest health impact from marine-derived pollution, such as from shipping and port activities, with 3,500 related early deaths. Emissions-related deaths from rail activities were comparatively slight, and spread uniformly across the east-central part of the country and the Midwest.
While the study is based on data from 2005, Barrett says the results are likely representative of today’s pollution-related health risks.
Jonathan Levy, a professor of environmental health at Boston University, says Barrett’s calculations for the overall number of premature deaths related to combustion emissions agree with similar conclusions by the Environmental Protection Agency. The group’s results — particularly the breakdown of emissions by state — provide valuable data in setting future environmental policy, he says.
“A public-health burden of this magnitude clearly requires significant policy attention, especially since technologies are readily available to address a significant fraction of these emissions,” says Levy, who was not involved in the research. “We have certainly invested significant societal resources to address far smaller impacts on public health.”
The group tracked ground-level emissions from sources such as industrial smokestacks, vehicle tailpipes, marine and rail operations, and commercial and residential heating throughout the United States, and found that such air pollution causes about 200,000 early deaths each year. Emissions from road transportation are the most significant contributor, causing 53,000 premature deaths, followed closely by power generation, with 52,000.
In a state-by-state analysis, the researchers found that California suffers the worst health impacts from air pollution, with about 21,000 early deaths annually, mostly attributed to road transportation and to commercial and residential emissions from heating and cooking.
The researchers also mapped local emissions in 5,695 U.S. cities, finding the highest emissions-related mortality rate in Baltimore, where 130 out of every 100,000 residents likely die in a given year due to long-term exposure to air pollution.
“In the past five to 10 years, the evidence linking air-pollution exposure to risk of early death has really solidified and gained scientific and political traction,” says Steven Barrett, an assistant professor of aeronautics and astronautics at MIT. “There’s a realization that air pollution is a major problem in any city, and there’s a desire to do something about it.”
Barrett and his colleagues have published their results in the journal Atmospheric Environment.
Data divided
Barrett says that a person who dies from an air pollution-related cause typically dies about a decade earlier than he or she otherwise might have. To determine the number of early deaths from air pollution, the team first obtained emissions data from the Environmental Protection Agency’s National Emissions Inventory, a catalog of emissions sources nationwide. The researchers collected data from the year 2005, the most recent data available at the time of the study.
They then divided the data into six emissions sectors: electric power generation; industry; commercial and residential sources; road transportation; marine transportation; and rail transportation. Barrett’s team fed the emissions data from all six sources into an air-quality simulation of the impact of emissions on particles and gases in the atmosphere.
To see where emissions had the greatest impact, they removed each sector of interest from the simulation and observed the difference in pollutant concentrations. The team then overlaid the resulting pollutant data on population-density maps of the United States to observe which populations were most exposed to pollution from each source.
Health impacts sector by sector
The greatest number of emissions-related premature deaths came from road transportation, with 53,000 early deaths per year attributed to exhaust from the tailpipes of cars and trucks.
“It was surprising to me just how significant road transportation was,” Barrett observes, “especially when you imagine [that] coal-fired power stations are burning relatively dirty fuel.”
One explanation may be that vehicles tend to travel in populated areas, increasing large populations’ pollution exposure, whereas power plants are generally located far from most populations and their emissions are deposited at a higher altitude.
Pollution from electricity generation still accounted for 52,000 premature deaths annually. The largest impact was seen in the east-central United States and in the Midwest: Eastern power plants tend to use coal with higher sulfur content than Western plants.
Unsurprisingly, most premature deaths due to commercial and residential pollution sources, such as heating and cooking emissions, occurred in densely populated regions along the East and West coasts. Pollution from industrial activities was highest in the Midwest, roughly between Chicago and Detroit, as well as around Philadelphia, Atlanta and Los Angeles. Industrial emissions also peaked along the Gulf Coast region, possibly due to the proximity of the largest oil refineries in the United States.
Southern California saw the largest health impact from marine-derived pollution, such as from shipping and port activities, with 3,500 related early deaths. Emissions-related deaths from rail activities were comparatively slight, and spread uniformly across the east-central part of the country and the Midwest.
While the study is based on data from 2005, Barrett says the results are likely representative of today’s pollution-related health risks.
Jonathan Levy, a professor of environmental health at Boston University, says Barrett’s calculations for the overall number of premature deaths related to combustion emissions agree with similar conclusions by the Environmental Protection Agency. The group’s results — particularly the breakdown of emissions by state — provide valuable data in setting future environmental policy, he says.
“A public-health burden of this magnitude clearly requires significant policy attention, especially since technologies are readily available to address a significant fraction of these emissions,” says Levy, who was not involved in the research. “We have certainly invested significant societal resources to address far smaller impacts on public health.”