On land, it’s fairly obvious where one ecological region ends and another begins, for instance at the boundary between a desert and savanna. In the ocean, much of life is microscopic and far more mobile, making it challenging for scientists to map the boundaries between ecologically distinct marine regions.
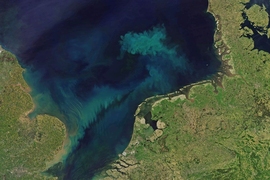
One way scientists delineate marine communities is through satellite images of chlorophyll, the green pigment produced by phytoplankton. Chlorophyll concentrations can indicate how rich or productive the underlying ecosystem might be in one region versus another. But chlorophyll maps can only give an idea of the total amount of life that might be present in a given region. Two regions with the same concentration of chlorophyll may in fact host very different combinations of plant and animal life.
“It’s like if you were to look at all the regions on land that don’t have a lot of biomass, that would include Antarctica and the Sahara, even though they have completely different ecological assemblages,” says Maike Sonnewald, a former postdoc in MIT’s Department of Earth, Atmospheric and Planetary Sciences.
Now Sonnewald and her colleagues at MIT have developed an unsupervised machine-learning technique that automatically combs through a highly complicated set of global ocean data to find commonalities between marine locations, based on their ratios and interactions between multiple phytoplankton species. With their technique, the researchers found that the ocean can be split into over 100 types of “provinces” that are distinct in their ecological makeup. Any given location in the ocean would conceivably fit into one of these 100 ecological provinces.
The researchers then looked for similarities between these 100 provinces, ultimately grouping them into 12 more general categories. From these “megaprovinces,” they were able to see that, while some had the same total amount of life within a region, they had very different community structures, or balances of animal and plant species. Sonnewald says capturing these ecological subtleties is essential to tracking the ocean’s health and productivity.
“Ecosystems are changing with climate change, and the community structure needs to be monitored to understand knock on effects on fisheries and the ocean’s capacity to draw down carbon dioxide,” Sonnewald says. “We can't fully understand these vital dynamics with conventional methods, that to date don’t include the ecology that’s there. But our method, combined with satellite data and other tools, could offer important progress.”
Sonnewald, who is now an associate research scholar at Princeton University and a visitor at the University of Washington, has reported the results today in the journal Science Advances. Her coauthors at MIT are Senior Research Scientist Stephanie Dutkiewitz, Principal Research Engineer Christopher Hill, and Research Scientist Gael Forget.
Rolling out a data ball
The team’s new machine learning technique, which they’ve named SAGE, for the Systematic AGgregated Eco-province method, is designed to take large, complicated datasets, and probabilistically project that data down to a simpler, lower-dimensional dataset.
“It’s like making cookies,” Sonnewald says. “You take this horrifically complicated ball of data and roll it out to reveal its elements.”
In particular, the researchers used a clustering algorithm that Sonnewald says is designed to “crawl along a dataset” and hone in on regions with a large density of points — a sign that these points share something in common.
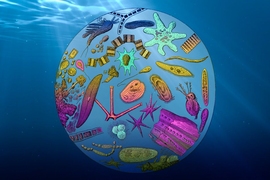
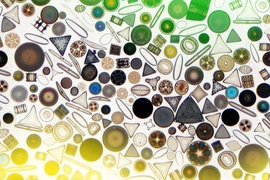
Sonnewald and her colleagues set this algorithm loose on ocean data from MIT’s Darwin Project, a three-dimensional model of the global ocean that combines a model of the ocean’s climate, including wind, current, and temperature patterns, with an ocean ecology model. That model includes 51 species of phytoplankton and the ways in which each species grows and interacts with each other as well as with the surrounding climate and available nutrients.
If one were to try and look through this very complicated, 51-layered space of data, for every available point in the ocean, to see which points share common traits, Sonnewald says the task would be “humanly intractable.” With the team’s unsupervised machine learning algorithm, such commonalities “begin to crystallize out a bit.”
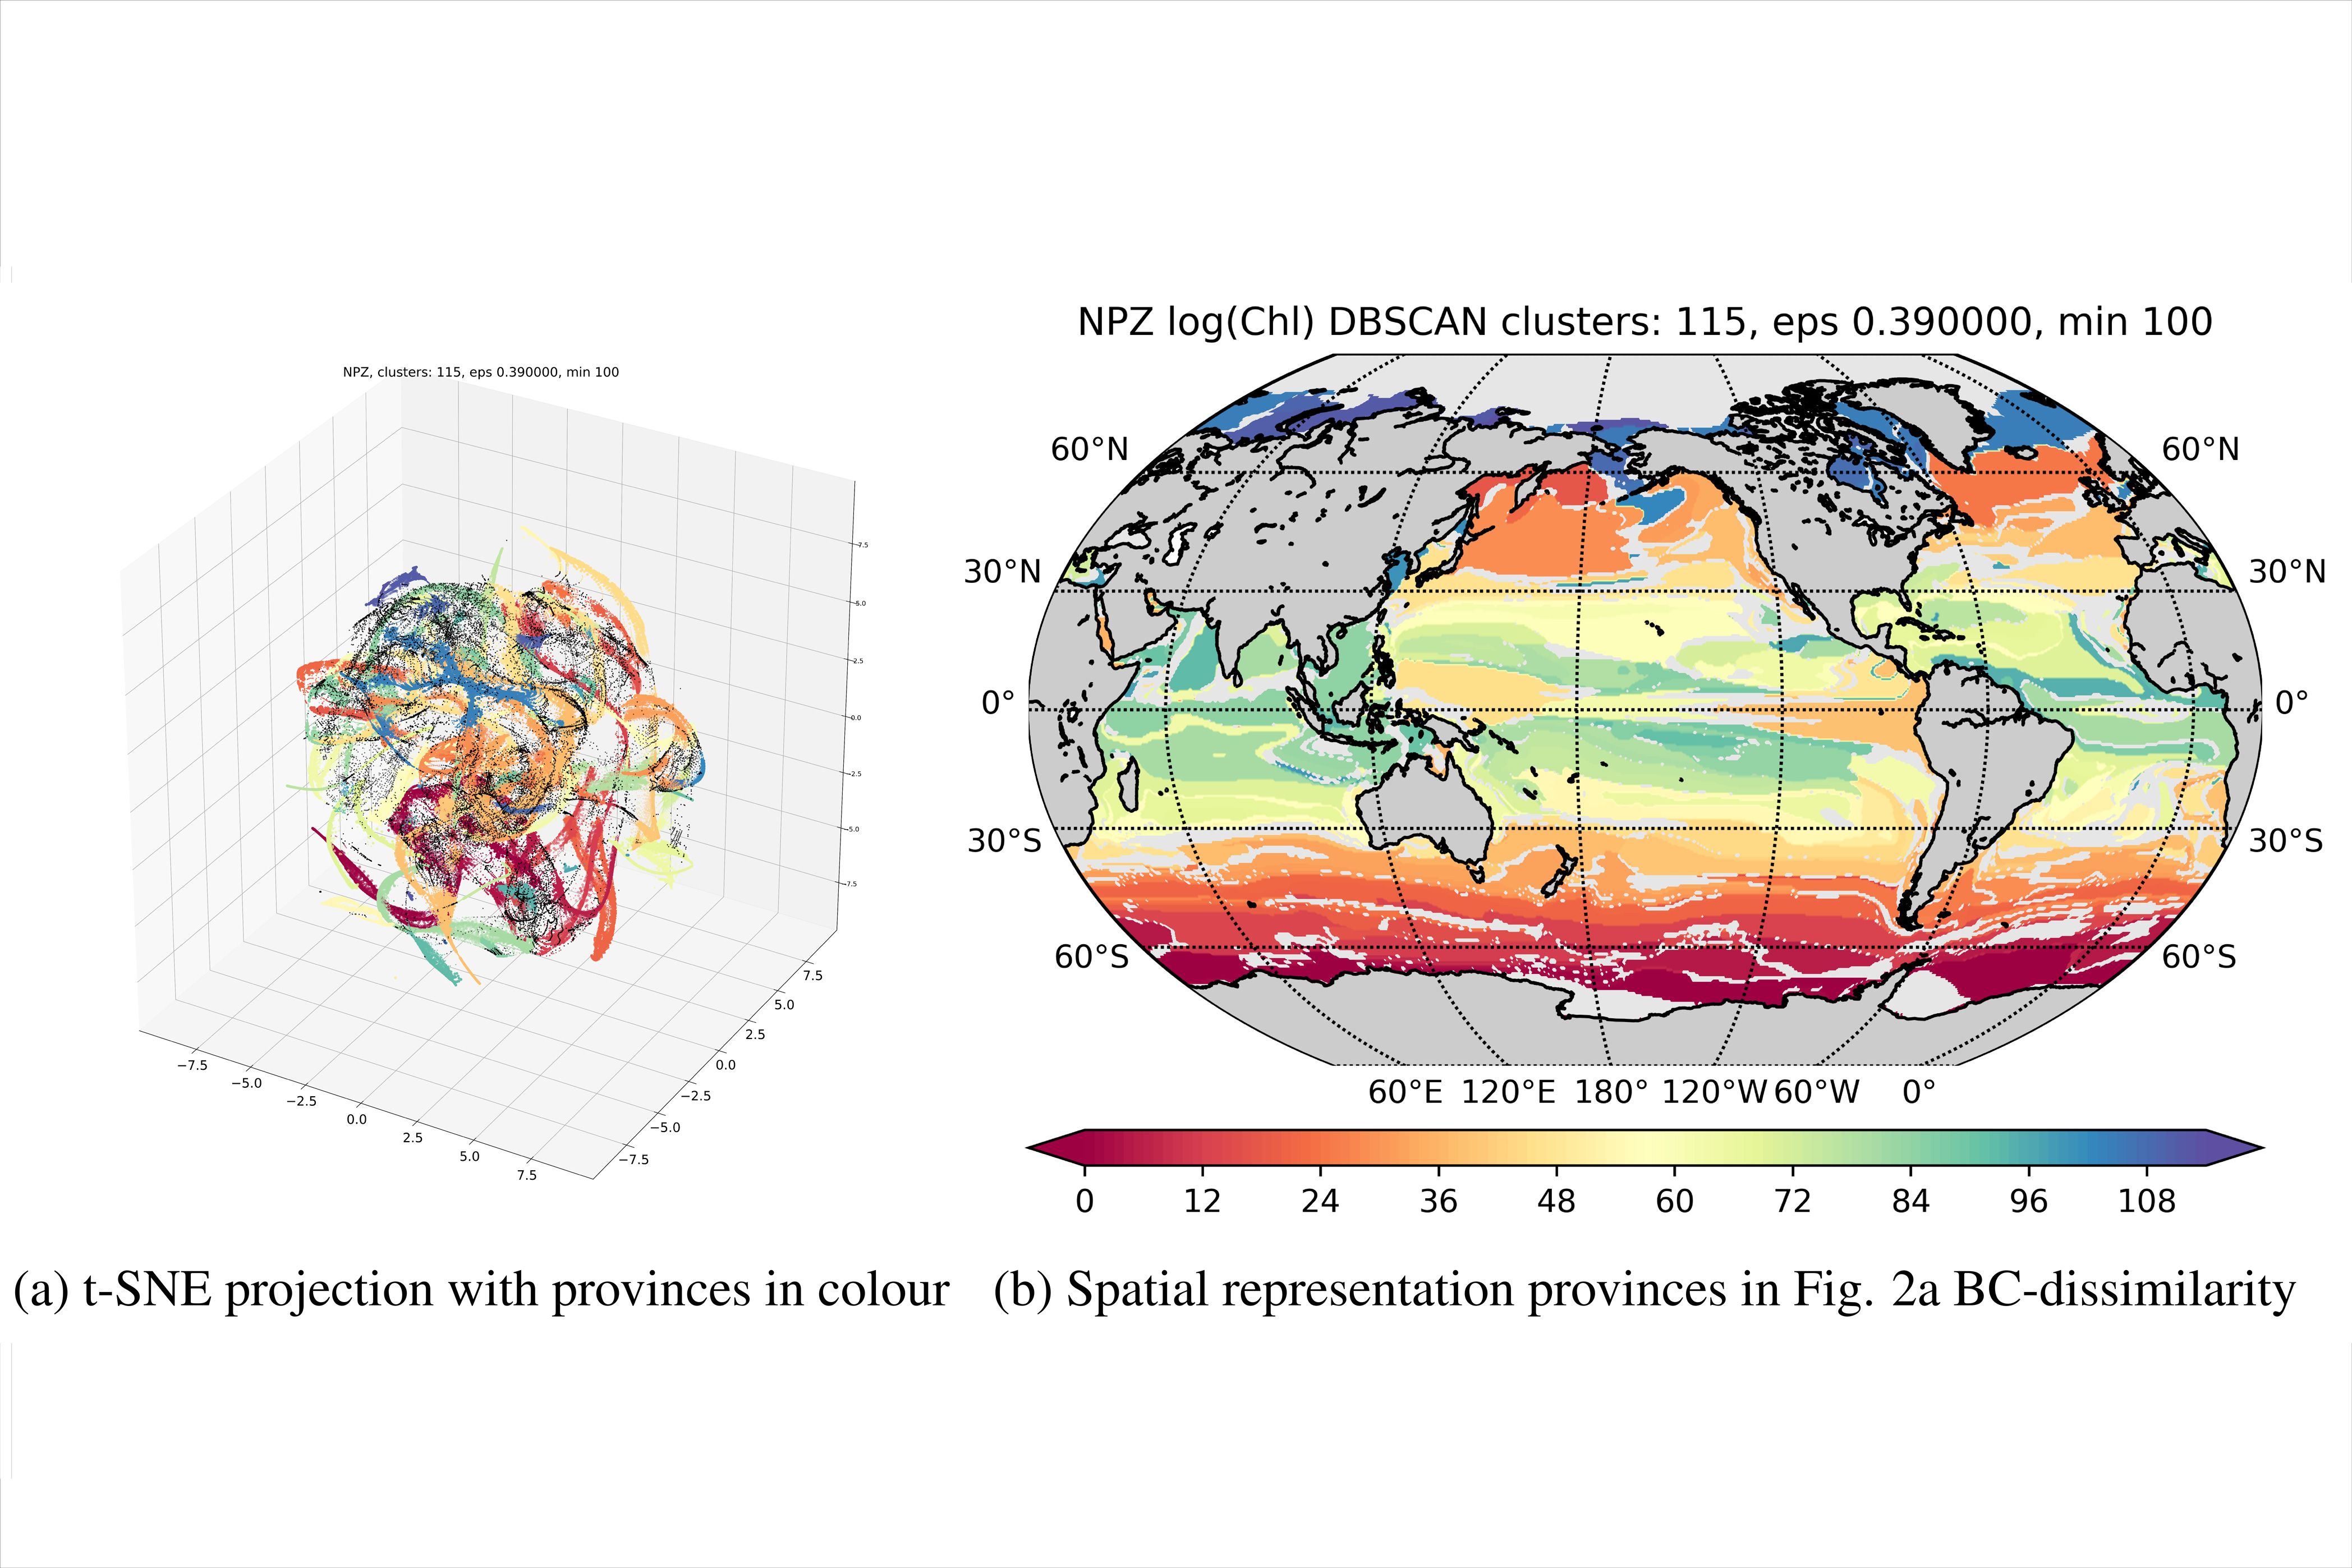
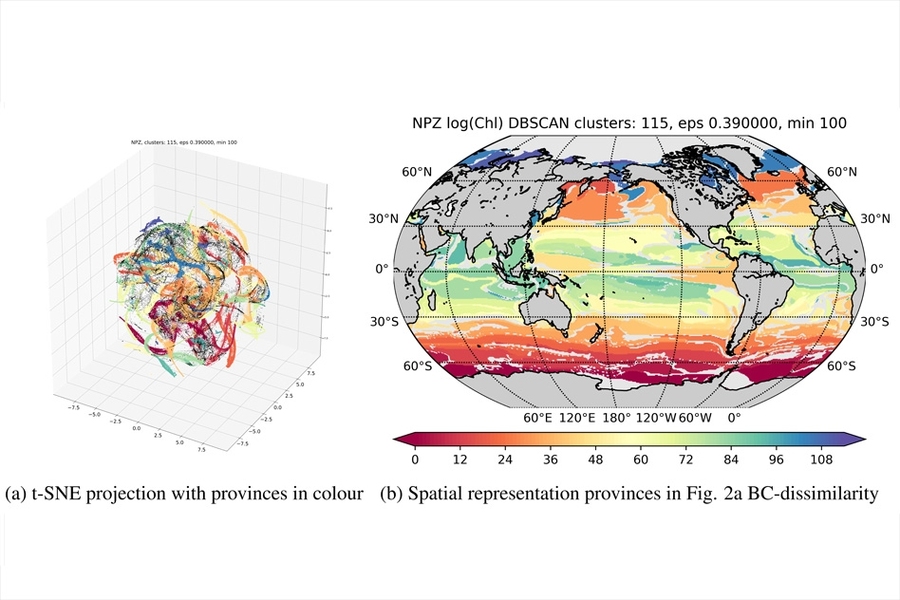
This first “data cleaning” step in the team’s SAGE method was able to parse the global ocean into about 100 different ecological provinces, each with a distinct balance of species.
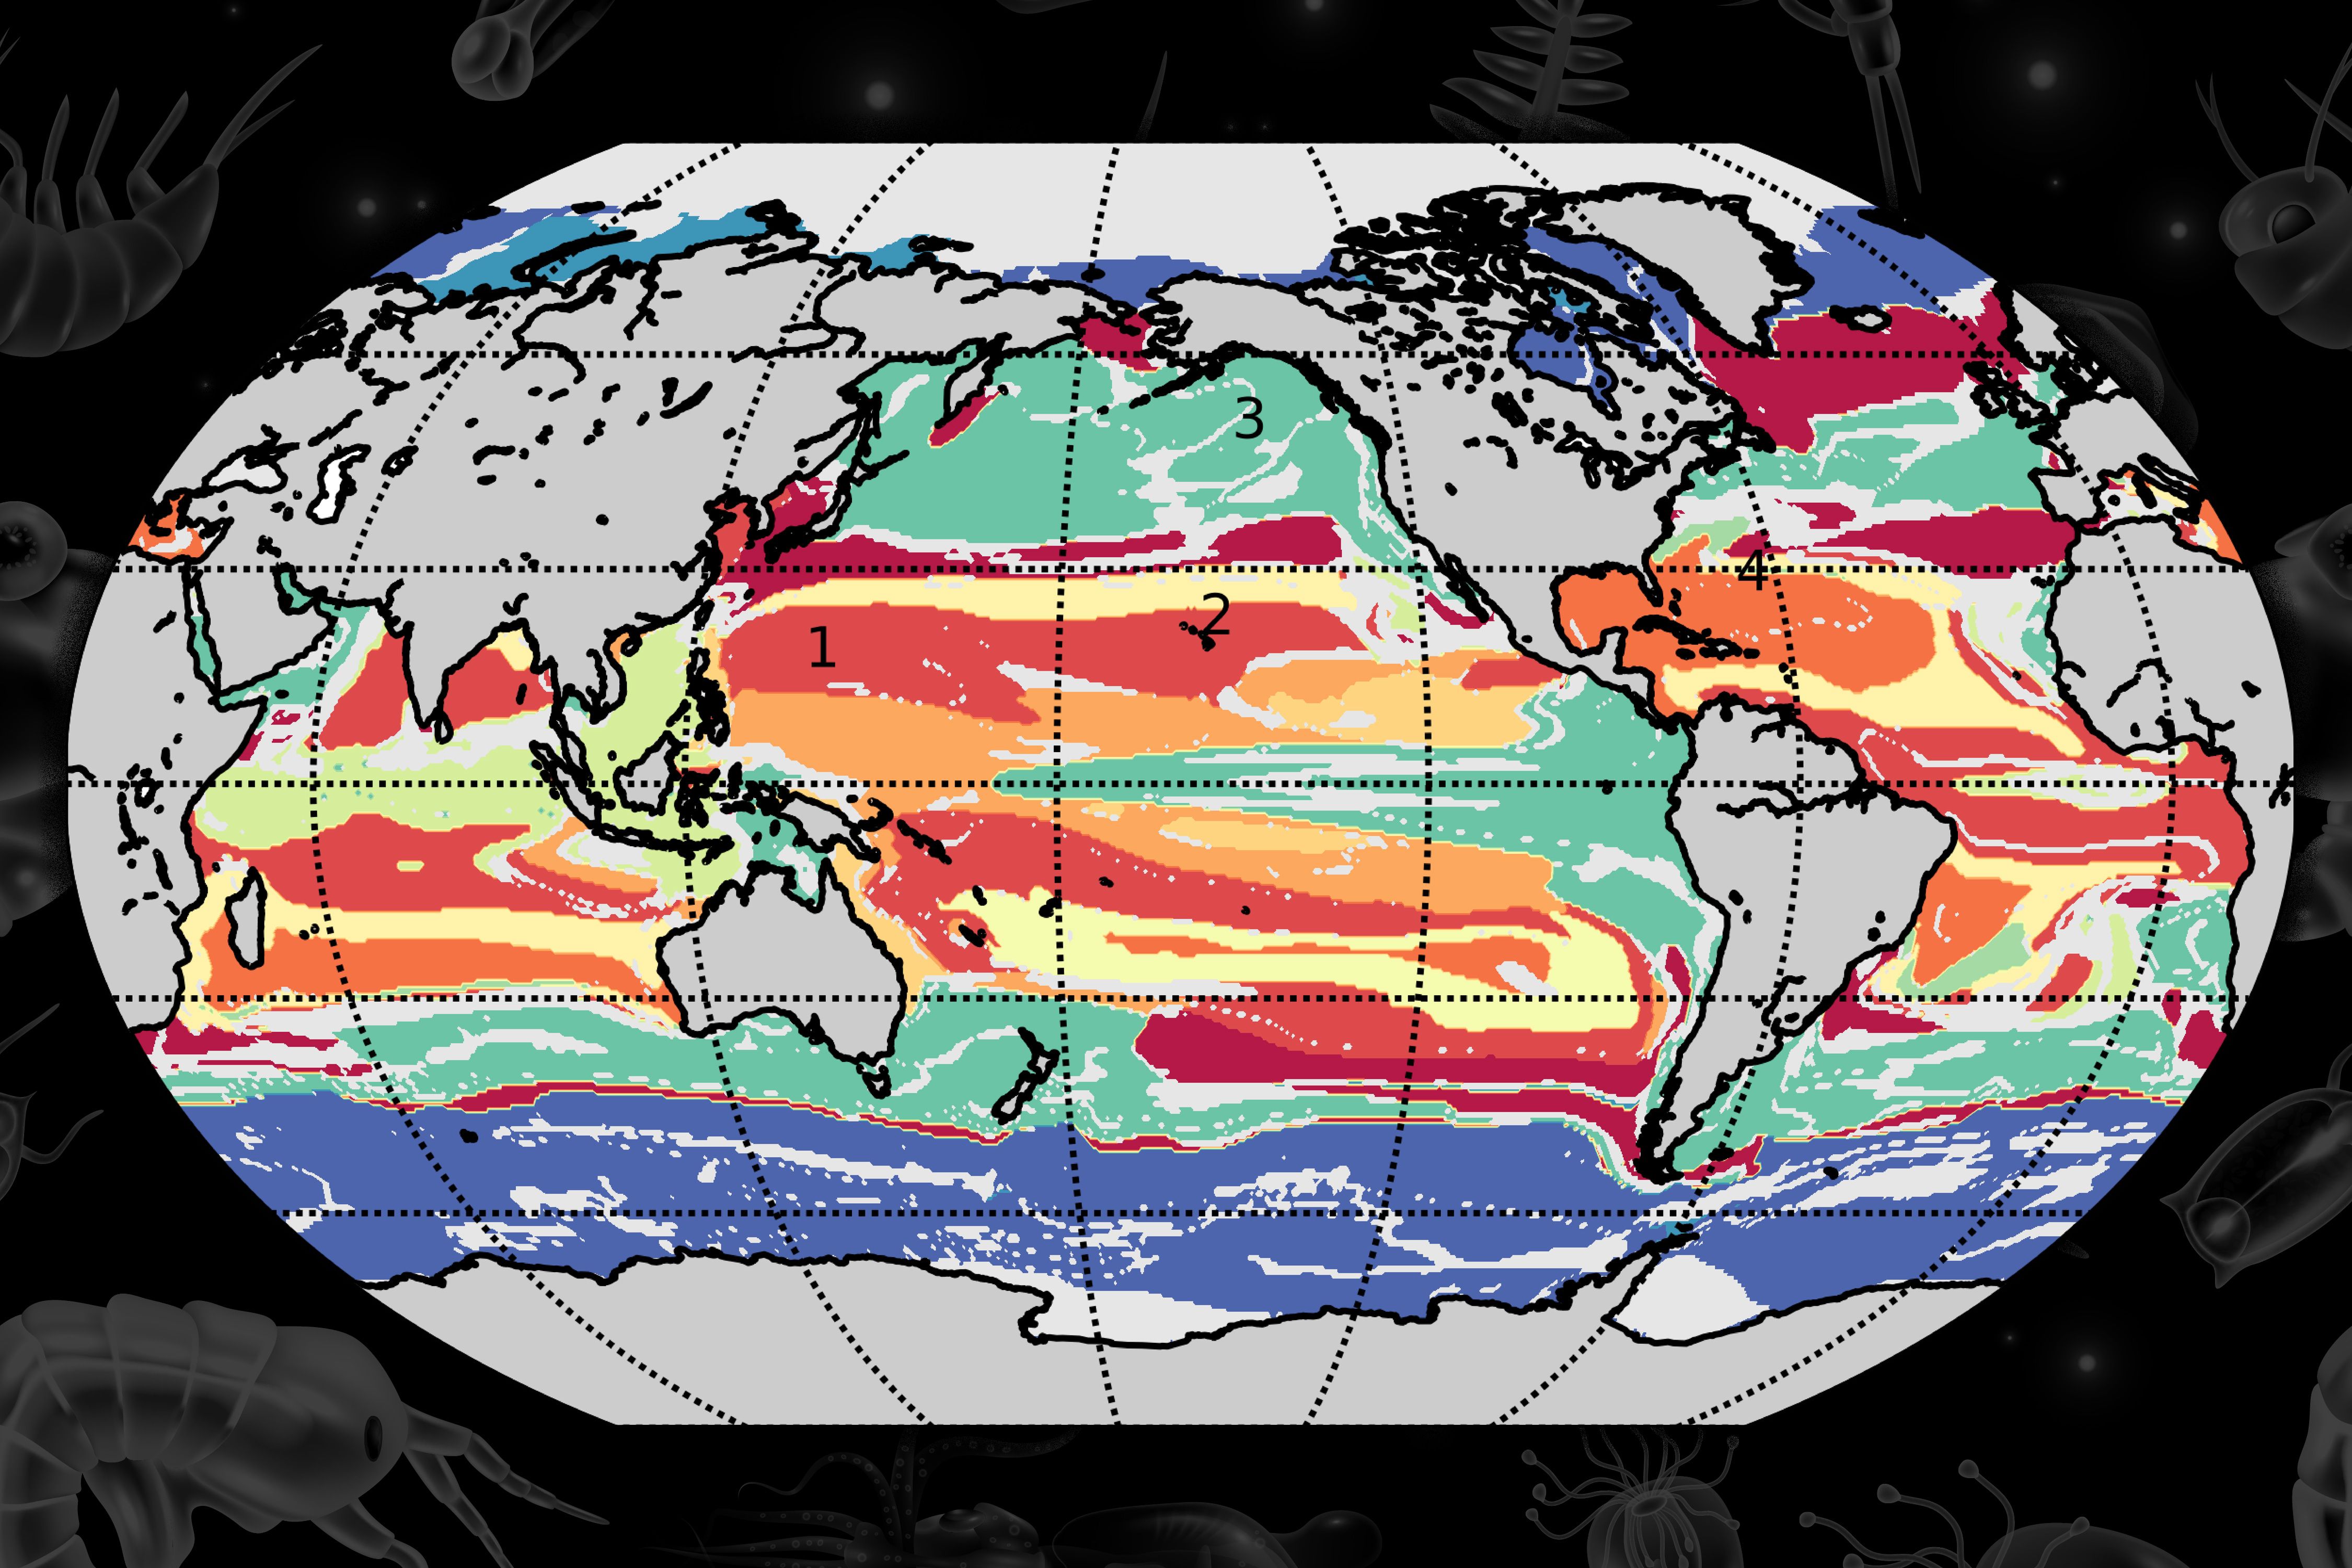
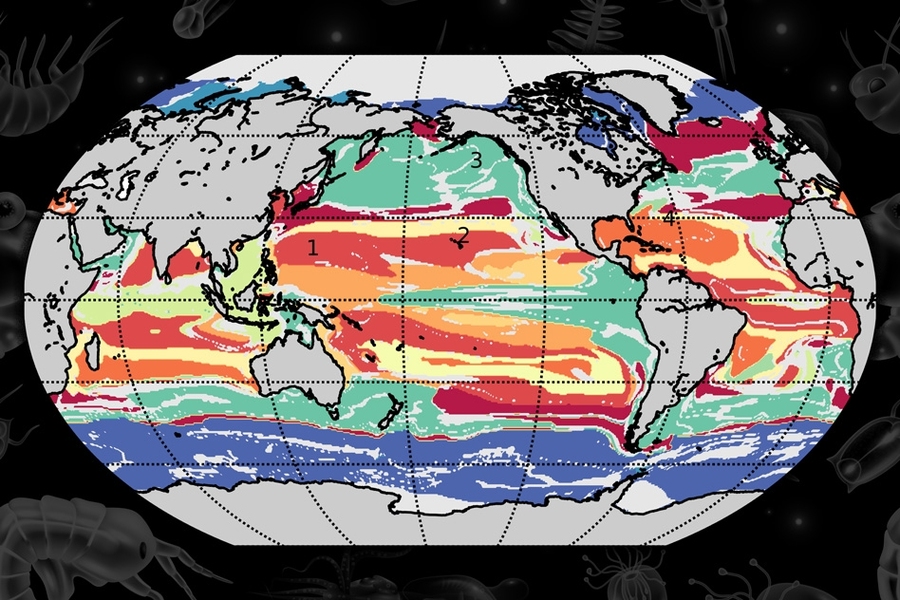
The researchers assigned each available location in the ocean model to one of the 100 provinces, and assigned a color to each province. They then generated a map of the global ocean, colorized by province type.
“In the Southern Ocean around Antarctica, there’s burgundy and orange colors that are shaped how we expect them, in these zonal streaks that encircle Antarctica,” Sonnewald says. “Together with other features, this gives us a lot of confidence that our method works and makes sense, at least in the model.”
Ecologies unified
The team then looked for ways to further simplify the more than 100 provinces they identified, to see whether they could pick out commonalities even among these ecologically distinct regions.
“We started thinking about things like, how are groups of people distinguished from each other? How do we see how connected to each other we are? And we used this type of intuition to see if we could quantify how ecologically similar different provinces are,” Sonnewald says.
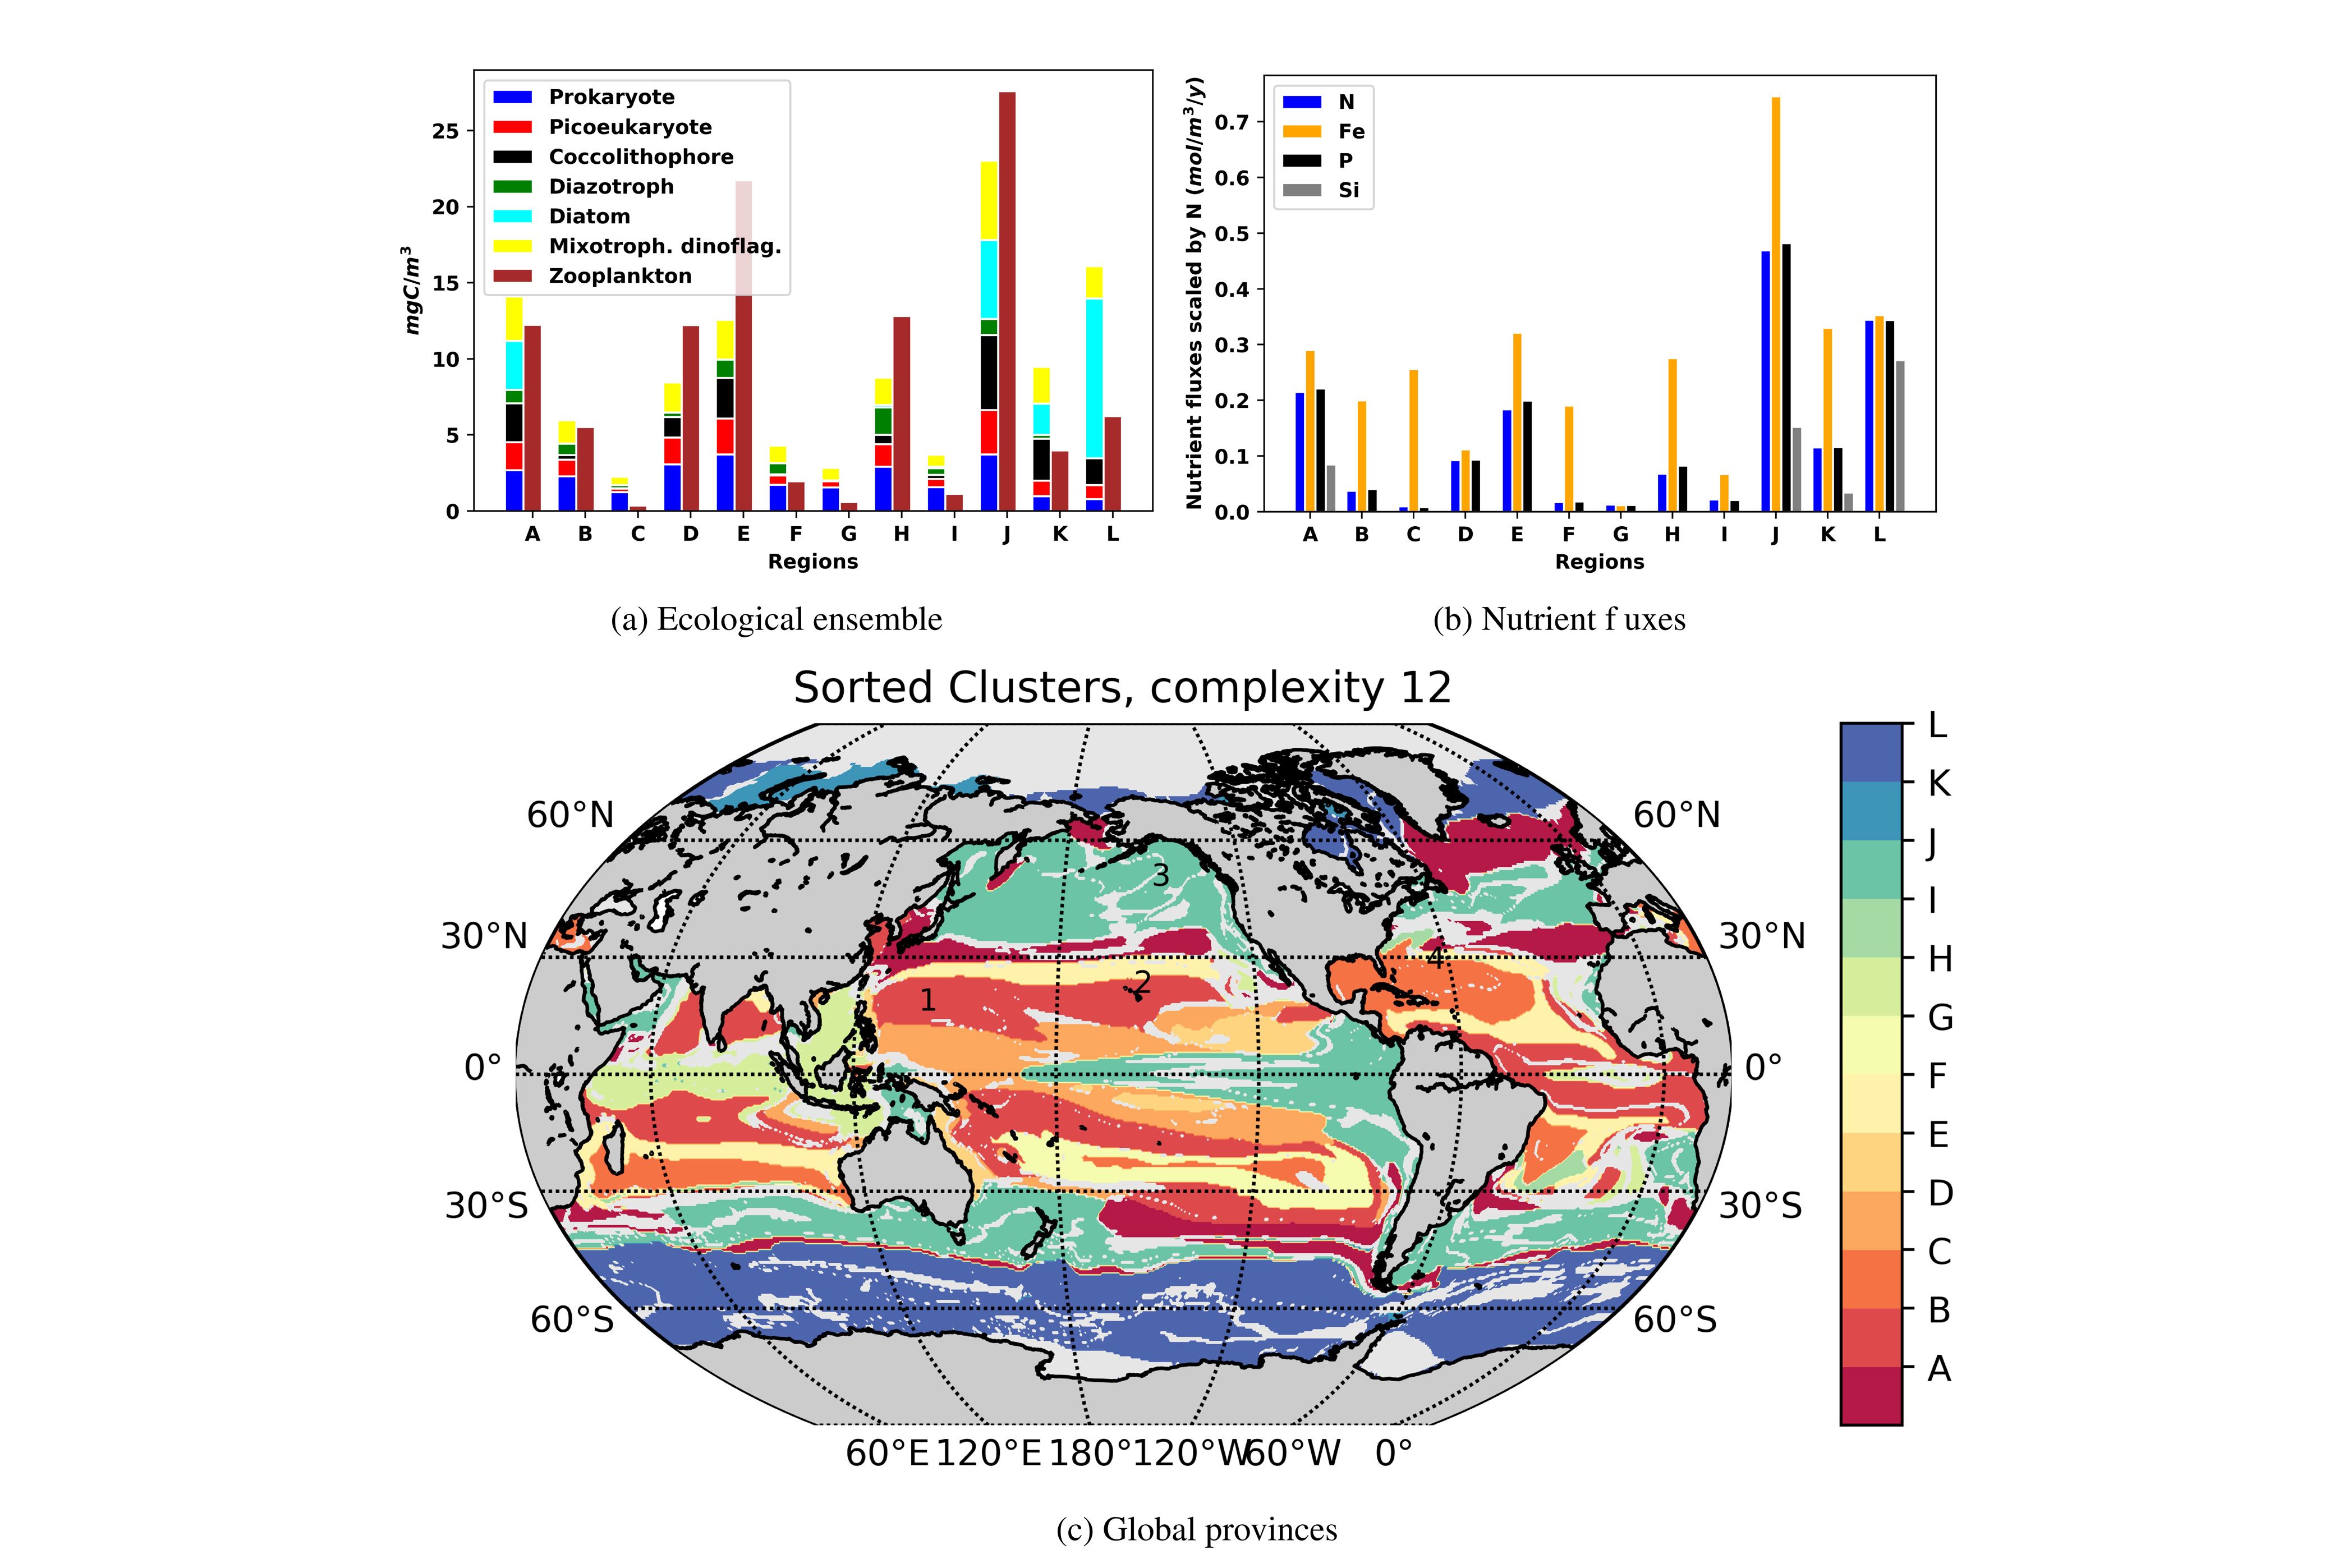
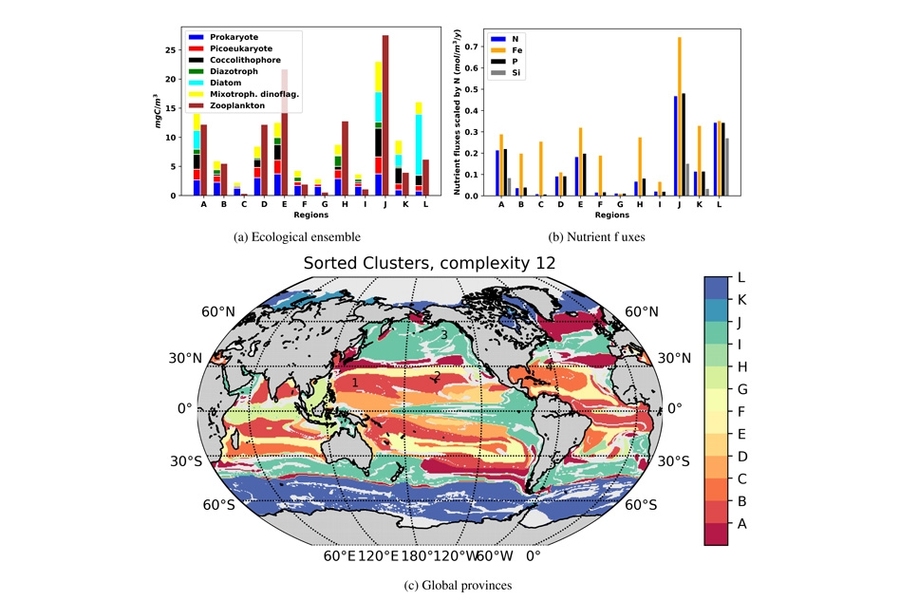
To do this, the team applied techniques from graph theory to represent all 100 provinces in a single graph, according to biomass — a measure that’s analogous to the amount of chlorophyll produced in a region. They chose to group the 100 provinces into 12 general categories, or “megaprovinces.” When they compared these megaprovinces, they found that those that had a similar biomass were composed of very different biological species.
“For instance, provinces D and K have almost the same amount of biomass, but when we look deeper, K has diatoms and hardly any prokaryotes, while D has hardly any diatoms, and a lot of prokaryotes. But from a satellite, they could look the same,” Sonnewald says. “So our method could start the process of adding the ecological information to bulk chlorophyll measures, and ultimately aid observations.”
The team has developed an online widget that researchers can use to find other similarities among the 100 provinces. In their paper, Sonnewald’s colleagues chose to group the provinces into 12 categories. But others may want to divide the provinces into more groups, and drill down into the data to see what traits are shared among these groups.
Sonnewald is sharing the tool with oceanographers who want to identify precisely where regions of a particular ecological makeup are located, so they could, for example, send ships to sample in those regions, and not in others where the balance of species might be slightly different.
“Instead of guiding sampling with tools based on bulk chlorophyll, and guessing where the interesting ecology could be found with this method, you can surgically go in and say, ‘this is what the model says you might find here,’” Sonnewald says. “Knowing what species assemblages are where, for things like ocean science and global fisheries, is really powerful.”
This research was funded, in part, by NASA and the Jet Propulsion Laboratory.