In January, MIT President L. Rafael Reif sent an update to the MIT community that described the international makeup of the campus. “Like the United States, and thanks to the United States, MIT gains tremendous strength by being a magnet for talent from around the world,” he wrote. “Faculty, students, post-docs, and staff from 134 other nations join us here because they love our mission, our values and our community.”
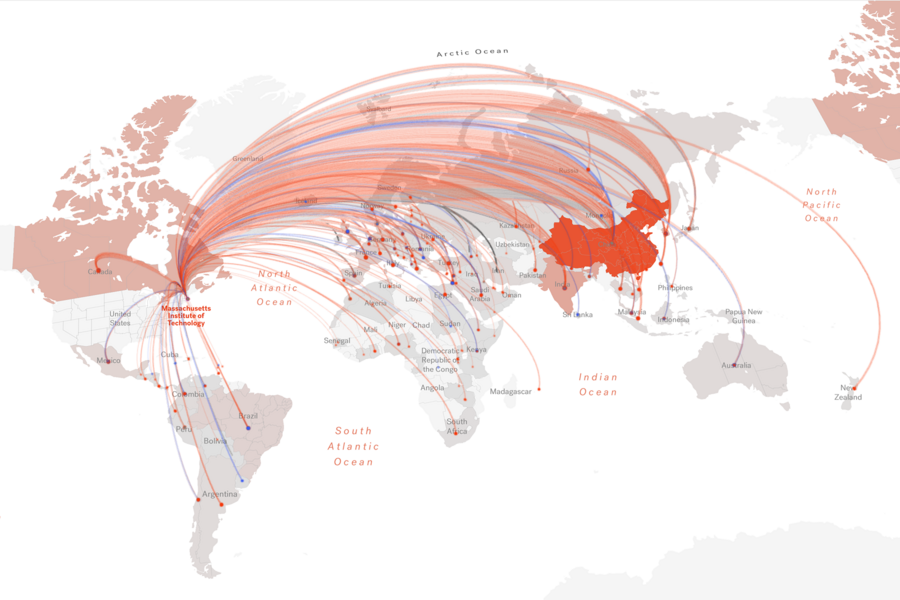
Inspired by President Reif’s description of MIT “magnificently global, absolutely American community,” researchers at the MIT Senseable City Lab recently studied 20 years of enthnographic data in order to visualize where international faculty, students, and researchers have come from over time. The result is “MIT World,” an online map showing the countries of origin of MIT students and scholars from 1999 to present.
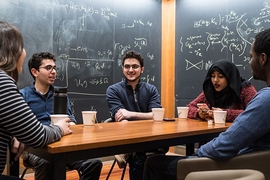
“The international nature of MIT’s community can be seen just by walking through campus each day,” says Newsha Ghaeli, an Iranian-born researcher from Canada working at the MIT Senseable City Lab, along with Wonyoung So, one of the project’s leaders, who came to MIT from South Korea. “At our lab alone, we currently work with colleagues from 19 different countries including India, Mexico, China, Russia, Israel, and Croatia. However, we wanted to dig a bit deeper in order to discover just how global MIT really is and how we can learn about our community by specifically seeing where our colleagues and peers come from.”
Using data from the International Students Office and the International Scholars Office, MIT World is an interactive map that allows users to pick a region or specific country to see the flows of students and scholars coming to Cambridge, Massachusetts, from that part of the world. Accompanying interactive graphs show the number of students and scholars per country and per year coming to MIT.
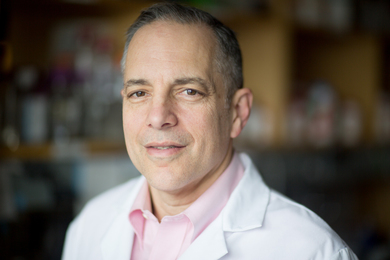
The researchers also credit the project for demonstrating the power of visualization as a platform to disseminate data to large audiences. “The raw data for MIT World is available online to anyone via the MIT website, but visualizing it creates a different understanding ,” says Carlo Ratti, the director of the Senseable City Lab, professor of the practice in the Department of Urban Studies and Planning, and a native of Italy. “Data visualization helps sharing insights with a broader audience.”
MIT World shows how openness and academic excellence go hand-in-hand, says Ghaeli. “The ability to attract the best global talent is what makes MIT what it is: a vibrant and diverse community driven to serve the nation and the world.”
!["Dedicated, smart people [can] contribute so much to our nation, but also to making the world a better place."](/sites/default/files/styles/news_article__archive/public/images/201702/featured-video-STEM-together.jpg?itok=kLQCE0Wk)