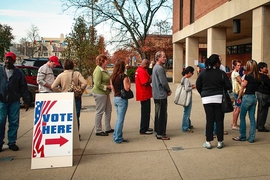
While many voters reported long lines at polling locations around the country during the 2012 presidential election, this year the overall amount of time people had to wait to vote improved significantly, according to a new survey examining voter experience during the 2016 presidential election. Charles Stewart III, the Kenan Sahin Distinguished Professor of Political Science at MIT, today presented the preliminary findings of the Survey on the Performance of American Elections (SPAE), during a conference hosted by the Pew Charitable Trusts on the evolution of voting administration since the 2012 election.
Stewart found that in a number of states where voters experienced some of the longest waiting times in the 2012 presidential election — including South Carolina, Virginia, and Maryland — there was notable improvement in 2016. In Florida, Stewart found “tremendous improvement in terms of how long people reported that they waited to vote.”
The findings show that “all the effort over the last four years that was invested in dealing with problems President Obama identified with lines, those efforts appear to have paid off,” Stewart says.
However, Stewart cautions that while the overall picture shows a trend in the right direction, voter experiences still vary between states, and some states still have a ways to go before wait times are within acceptable limits. For instance, in about half the states over 10 percent of voters waited more than 30 minutes to vote in 2016, which exceeds the benchmark established by the bipartisan Presidential Commission on Election Administration. Other states, such as North Carolina, saw significant improvement on Election Day that was not matched in early voting.
“The value of the SPAE is that it shines a spotlight on the specific places in America where further improvement is needed, while also identifying jurisdictions that may have a lesson to teach others,” Stewart explains.
The SPAE was conducted as part of the Pew Charitable Trusts Elections Performance Index, which is aimed at providing a comprehensive assessment of election administration across the nation. The index comprises data compiled on election administration policy and performance during the 2008, 2012, and 2014 elections, and will soon include information from the 2016 election.
For the 2016 SPAE, Stewart analyzed data gathered by YouGov, an Internet polling operation, starting the day after Election Day. Survey participants, who hailed from every state in the nation, were posed questions about critical factors impacting whether Americans are able to vote successfully. In particular, voters were asked if they experienced difficulties with finding their polling location, checking in or registering, sending in mail and absentee ballots, or operating voting machines.
The nationwide survey was created in the wake of the 2000 election, which left Americans unsure of the outcome of the presidential race and uncovered issues with several critical voting factors, including how ballots are marked and the accuracy of voter registration lists. Stewart developed the survey in an effort to better understand “the voters’ perspective on how they perceive the act of voting. It is important to figure out whether certain problems are widespread and common, or focused in particular states,” he says.
The first survey was conducted in 2008, and it was repeated during the 2012, 2014, and 2016 elections to get an accurate look at the “general satisfaction with each of the critical links in the voting chain,” Stewart explains.
Early voting
Stewart’s analysis shows the number of people voting ahead of Election Day, either through mail or absentee ballots or early voting opportunities, has continued to increase since the 2012 election, with almost half of the electorate voting beforehand. While an increasing number of Americans are voting prior to Election Day, according to Stewart, researchers have a less complete understanding of best practices for early voting administration.
For example, while people waited for a shorter time overall to vote on Election Day in 2016, the survey’s findings show people who vote early wait longer than those who vote on Election Day. Research could be conducted into the best hours and locations for early voting locations, and ways to make mail and absentee ballots more secure and less error prone, Stewart notes.
Furthermore, the results show that the overall discrepancy in voting experience between black and white Americans continues. On a national level the disparity between waiting times for black and white voters improved among Election Day voters during the 2016 election, but the gap between waiting times for black and white Americans voting early has not improved significantly since the 2012 election, according to the survey.
In an effort to examine which constituents took advantage of early voting opportunities, survey participants were asked how early voting fit into their daily activities. Stewart found that many people who participated in early voting did not have work or school obligations on the day they voted, and that many early voters identified themselves as retired, stay-at-home parents, or unemployed.
These findings point to an issue with how early voting is implemented in many jurisdictions, Stewart explains. “If you are trying to design early voting in a way that’s convenient for people, then these findings tell you that election administrators will want to take into account the different schedules of early voters compared to Election Day voters,” he says.
Voter confidence
The survey also examined voter confidence following the 2016 presidential election among the different political parties. While Democrats became less confident that their vote was counted as cast, Republicans became more confident. While this finding is historically in line with how voters from the winning and losing political parties tend to feel about the integrity of the election results, Stewart believes that President-elect Donald Trump’s attack on the legitimacy of the election may, ironically enough, have reduced the drop in Democrats’ confidence in the integrity of the election outcome.
Additionally, Stewart notes that a majority of voters tended to be more confident about the integrity of their individual vote and the votes counted in their locality than they were about election reporting on the state and national levels.
Going forward, Stewart is interested in seeing more state and local election officials conduct postelection surveys evaluating the voter experience. Stewart explains that replicating his nationwide survey at a local level could provide “opportunities for states and localities to build off of our model and conduct their own surveys. These surveys provide a benchmark at the state level and nationally against which you can judge your jurisdictions’s performance and find out what voters think about their experience and how you can improve.”