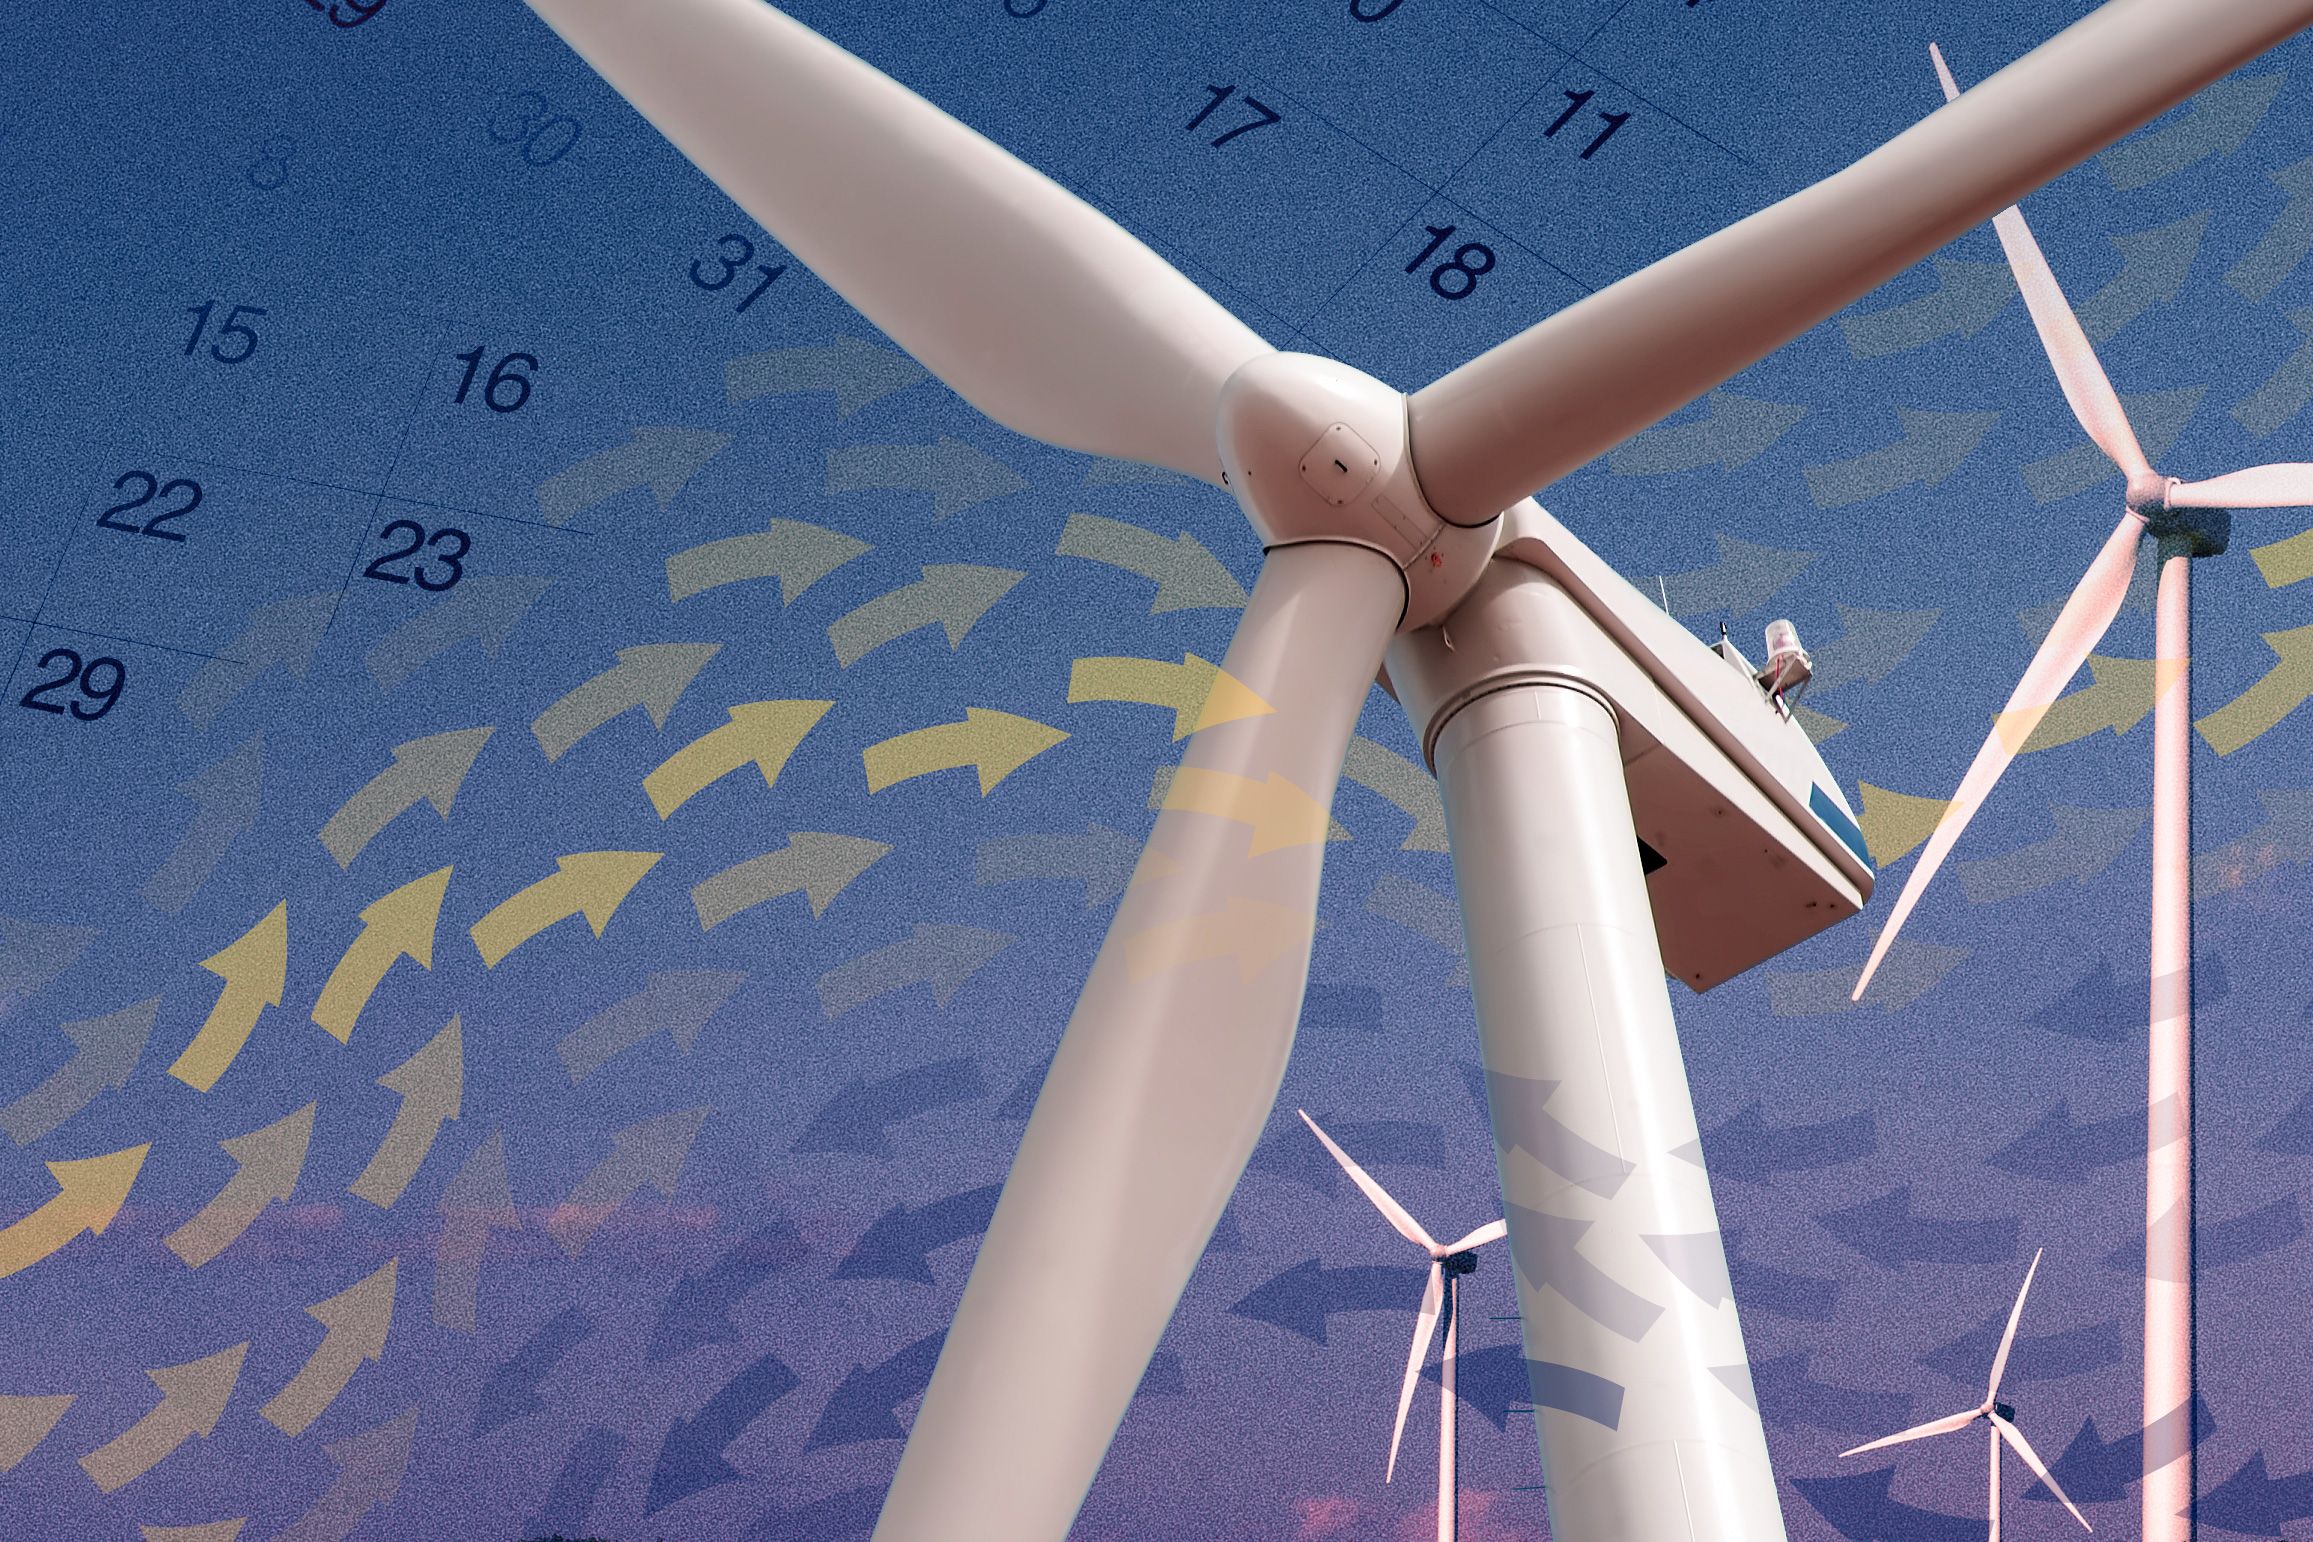
When a power company wants to build a new wind farm, it generally hires a consultant to make wind speed measurements at the proposed site for eight to 12 months. Those measurements are correlated with historical data and used to assess the site’s power-generation capacity.
At the International Joint Conference on Artificial Intelligence later this month, MIT researchers will present a new statistical technique that yields better wind-speed predictions than existing techniques do — even when it uses only three months’ worth of data. That could save power companies time and money, particularly in the evaluation of sites for offshore wind farms, where maintaining measurement stations is particularly costly.
“We talked with people in the wind industry, and we found that they were using a very, very simplistic mechanism to estimate the wind resource at a site,” says Kalyan Veeramachaneni, a research scientist at MIT’s Computer Science and Artificial Intelligence Laboratory (CSAIL) and first author on the new paper. In particular, Veeramachaneni says, standard practice in the industry is to model correlations in wind-speed data using a so-called Gaussian distribution — the “bell curve” familiar from basic statistics.
“The data here is non-Gaussian; we all know that,” Veeramachaneni says. “You can fit a bell curve to it, but that’s not an accurate representation of the data.”
Typically, a wind energy consultant will find correlations between wind speed measurements at a proposed site and those made, during the same period, at a nearby weather station where records stretch back for decades. On the basis of those correlations, the consultant will adjust the weather station’s historical data to provide an approximation of wind speeds at the new site.
The correlation model is what’s known in statistics as a joint distribution. That means that it represents the probability not only of a particular measurement at one site, but of that measurement’s coincidence with a particular measurement at the other. Wind-industry consultants, Veeramachaneni says, usually characterize that joint distribution as a Gaussian distribution.
Different curves
The first novelty of the model that Veeramachaneni developed with his colleagues — Una-May O'Reilly, a principal research scientist at CSAIL, and Alfredo Cuesta-Infante of the Universidad Rey Juan Carlos in Madrid — is that it can factor in data from more than one weather station. In some of their analyses, the researchers used data from 15 or more other sites.
But its main advantage is that it’s not restricted to Gaussian probability distributions. Moreover, it can use different types of distributions to characterize data from different sites, and it can combine them in different ways. It can even use so-called nonparametric distributions, in which the data are described not by a mathematical function, but by a collection of samples, much the way a digital music file consists of discrete samples of a continuous sound wave.
Another aspect of the model is that it can find nonlinear correlations between data sets. Standard regression analysis, of the type commonly used in the wind industry, identifies the straight line that best approximates a scattering of data points, according to some distance measure. But often, a curved line would offer a better approximation. The researchers’ model allows for that possibility.
Validation
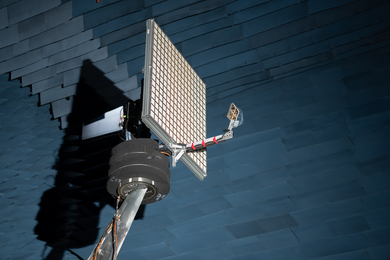
The researchers first applied their technique to data collected from an anemometer on top of the MIT Museum, which was looking to install a wind turbine on its roof. Once they had evidence of their model’s accuracy, they applied it to data provided to them by a major consultant in the wind industry.
With only three months of the company’s historical data for a particular wind farm site, Veeramachaneni and his colleagues were able to predict wind speeds over the next two years three times as accurately as existing models could with eight months of data. Since then, the researchers have improved their model by evaluating alternative ways of calculating joint distributions. According to additional analysis of the data from the Museum of Science, which is reported in the new paper, their revised approach could double the accuracy of their predictions.
Justin Dauwels, an assistant professor of electrical engineering at Nanyang Technological University, is an expert on “copulas,” the statistical technique the MIT researchers used to couple different types of probability distributions. “Veeramachaneni’s team proposed a model that is eminently well-suited for a significant real-world application,” Dauwels says. “By accurately describing the non-Gaussian statistics, the copula-based models outshine classical Gaussian models, providing accurate marginal distributions at the test locations from far fewer measurements. This methodology has strong practical value, and I am convinced that it will be applicable to many other real-life problems.”