Regression analysis. It sounds like a part of Freudian psychology. In reality, a regression is a seemingly ubiquitous statistical tool appearing in legions of scientific papers, and regression analysis is a method of measuring the link between two or more phenomena.
Imagine you want to know the connection between the square footage of houses and their sale prices. A regression charts such a link, in so doing pinpointing “an average causal effect,” as MIT economist Josh Angrist and his co-author Jorn-Steffen Pischke of the London School of Economics put it in their 2009 book, “Mostly Harmless Econometrics.”
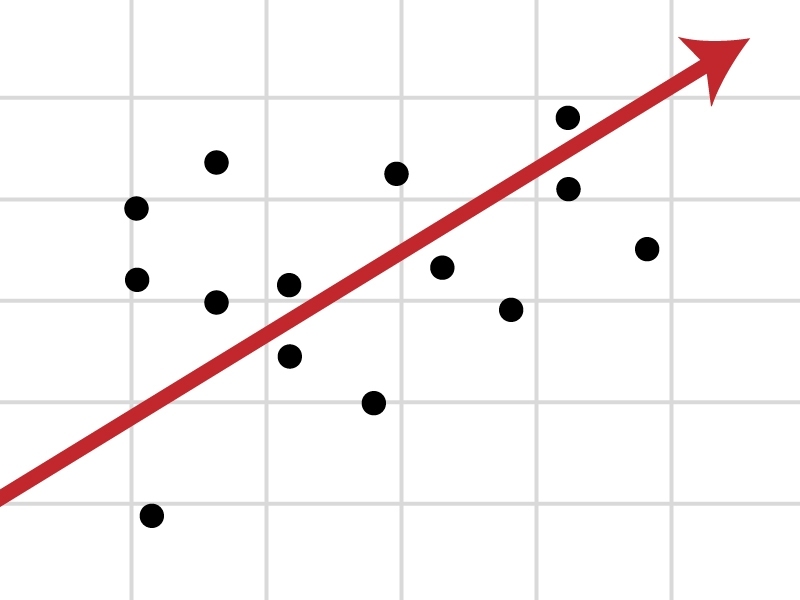
To grasp the basic concept, take the simplest form of a regression: a linear, bivariate regression, which describes an unchanging relationship between two (and not more) phenomena. Now suppose you are wondering if there is a connection between the time high school students spend doing French homework, and the grades they receive. These types of data can be plotted as points on a graph, where the x-axis is the average number of hours per week a student studies, and the y-axis represents exam scores out of 100. Together, the data points will typically scatter a bit on the graph. The regression analysis creates the single line that best summarizes the distribution of points.
Mathematically, the line representing a simple linear regression is expressed through a basic equation: Y = a0 + a1 X. Here X is hours spent studying per week, the “independent variable.” Y is the exam scores, the “dependent variable,” since — we believe — those scores depend on time spent studying. Additionally, a0 is the y-intercept (the value of Y when X is zero) and a1 is the slope of the line, characterizing the relationship between the two variables.
Using two slightly more complex equations, the “normal equations” for the basic linear regression line, we can plug in all the numbers for X and Y, solve for a0 and a1, and actually draw the line. That line often represents the lowest aggregate of the squares of the distances between all points and itself, the “Ordinary Least Squares” (OLS) method mentioned in mountains of academic papers.
To see why OLS is logical, imagine a regression line running 6 units below one data point and 6 units above another point; it is 6 units away from the two points, on average. Now suppose a second line runs 10 units below one data point and 2 units above another point; it is also 6 units away from the two points, on average. But if we square the distances involved, we get different results: 62 + 62 = 72 in the first case, and 102 + 22 = 104 in the second case. So the first line yields the lower figure — the “least squares” — and is a more consistent reduction of the distance from the data points. (Additional methods, besides OLS, can find the best line for more complex forms of regression analysis.)
In turn, the typical distance between the line and all the points (sometimes called the “standard error”) indicates whether the regression analysis has captured a relationship that is strong or weak. The closer a line is to the data points, overall, the stronger the relationship.
Regression analysis, again, establishes a correlation between phenomena. But as the saying goes, correlation is not causation. Even a line that fits the data points closely may not say something definitive about causality. Perhaps some students do succeed in French class because they study hard. Or perhaps those students benefit from better natural linguistic abilities, and they merely enjoy studying more, but do not especially benefit from it. Perhaps there would be a stronger correlation between test scores and the total time students had spent hearing French spoken before they ever entered this particular class. The tale that emerges from good data may not be the whole story.
So it still takes critical thinking and careful studies to locate meaningful cause-and-effect relationships in the world. But at a minimum, regression analysis helps establish the existence of connections that call for closer investigation.
Imagine you want to know the connection between the square footage of houses and their sale prices. A regression charts such a link, in so doing pinpointing “an average causal effect,” as MIT economist Josh Angrist and his co-author Jorn-Steffen Pischke of the London School of Economics put it in their 2009 book, “Mostly Harmless Econometrics.”
To grasp the basic concept, take the simplest form of a regression: a linear, bivariate regression, which describes an unchanging relationship between two (and not more) phenomena. Now suppose you are wondering if there is a connection between the time high school students spend doing French homework, and the grades they receive. These types of data can be plotted as points on a graph, where the x-axis is the average number of hours per week a student studies, and the y-axis represents exam scores out of 100. Together, the data points will typically scatter a bit on the graph. The regression analysis creates the single line that best summarizes the distribution of points.
Mathematically, the line representing a simple linear regression is expressed through a basic equation: Y = a0 + a1 X. Here X is hours spent studying per week, the “independent variable.” Y is the exam scores, the “dependent variable,” since — we believe — those scores depend on time spent studying. Additionally, a0 is the y-intercept (the value of Y when X is zero) and a1 is the slope of the line, characterizing the relationship between the two variables.
Using two slightly more complex equations, the “normal equations” for the basic linear regression line, we can plug in all the numbers for X and Y, solve for a0 and a1, and actually draw the line. That line often represents the lowest aggregate of the squares of the distances between all points and itself, the “Ordinary Least Squares” (OLS) method mentioned in mountains of academic papers.
To see why OLS is logical, imagine a regression line running 6 units below one data point and 6 units above another point; it is 6 units away from the two points, on average. Now suppose a second line runs 10 units below one data point and 2 units above another point; it is also 6 units away from the two points, on average. But if we square the distances involved, we get different results: 62 + 62 = 72 in the first case, and 102 + 22 = 104 in the second case. So the first line yields the lower figure — the “least squares” — and is a more consistent reduction of the distance from the data points. (Additional methods, besides OLS, can find the best line for more complex forms of regression analysis.)
In turn, the typical distance between the line and all the points (sometimes called the “standard error”) indicates whether the regression analysis has captured a relationship that is strong or weak. The closer a line is to the data points, overall, the stronger the relationship.
Regression analysis, again, establishes a correlation between phenomena. But as the saying goes, correlation is not causation. Even a line that fits the data points closely may not say something definitive about causality. Perhaps some students do succeed in French class because they study hard. Or perhaps those students benefit from better natural linguistic abilities, and they merely enjoy studying more, but do not especially benefit from it. Perhaps there would be a stronger correlation between test scores and the total time students had spent hearing French spoken before they ever entered this particular class. The tale that emerges from good data may not be the whole story.
So it still takes critical thinking and careful studies to locate meaningful cause-and-effect relationships in the world. But at a minimum, regression analysis helps establish the existence of connections that call for closer investigation.